The dashboard
The dashboard is a web page that follows a design run while it happens. It shows each number of the chip (qubit frequency, anharmonicity, resonator frequency, coupling), where the number comes from (the design, the lumped model or a solver) and whether it meets its goal. You do not need it to design a chip, but it is the quickest way to see what a run did and what is still off target.
It is a React app (sources in reviewer/) built into src/quantcore_circuits/review/static/ and served by a small
Python backend (src/quantcore_circuits/review/server.py). You run it; you do not need to build it.
Start it
Open a terminal in the repository and activate the environment:
conda activate qcd.Start the server:
qcc dashboard              REM follows the run with the latest activity
qcc dashboard t04          REM pins the dashboard to the run build/t04
scripts\dashboard.cmd      REM the same, without activating the env
Open
http://127.0.0.1:8765/(it opens by itself unless you pass--no-open-browser;--portchanges the port).
qcc review DESIGN serves one design file instead of a tracked run. Without a run, the dashboard reads
build/_live.json to find the run that changed last.
Feed it from your code
The dashboard shows a run only when something records it.
In a notebook or script, call
track.start("t04", dashboard=True)or set the environment variableQCC_TRACK=1.After that, build, DRC, fill, simulate, loop and optimise steps report by themselves (
autotrack.py), and a watcher follows the FEM job folders.The state is one file,
build/<run>/state.json(its contract isreviewer/contract/state.ts). The screenshots of the layout go tobuild/<run>/shots/.
The backend has three routes: GET /api/state (the run), GET /api/events (server-sent events, so the page updates
live) and GET /files/<rel> (images and job files).
Tabs
Choose a tab in the top bar, or add ?tab= to the address: parameters (the default), layout, circuit,
hamiltonian, plots, simulation, history, log. ?el=Q1 selects an element and ?sample shows a fixture with no
backend. The screenshots are of kept runs.
Parameters
The first tab. A chip overview with the qubit table, the couplers, and one card per value. Each card shows the value, its
source tag (design.json, lom, FEM) and the goal with its tolerance. A value outside the tolerance gets a FAIL mark.
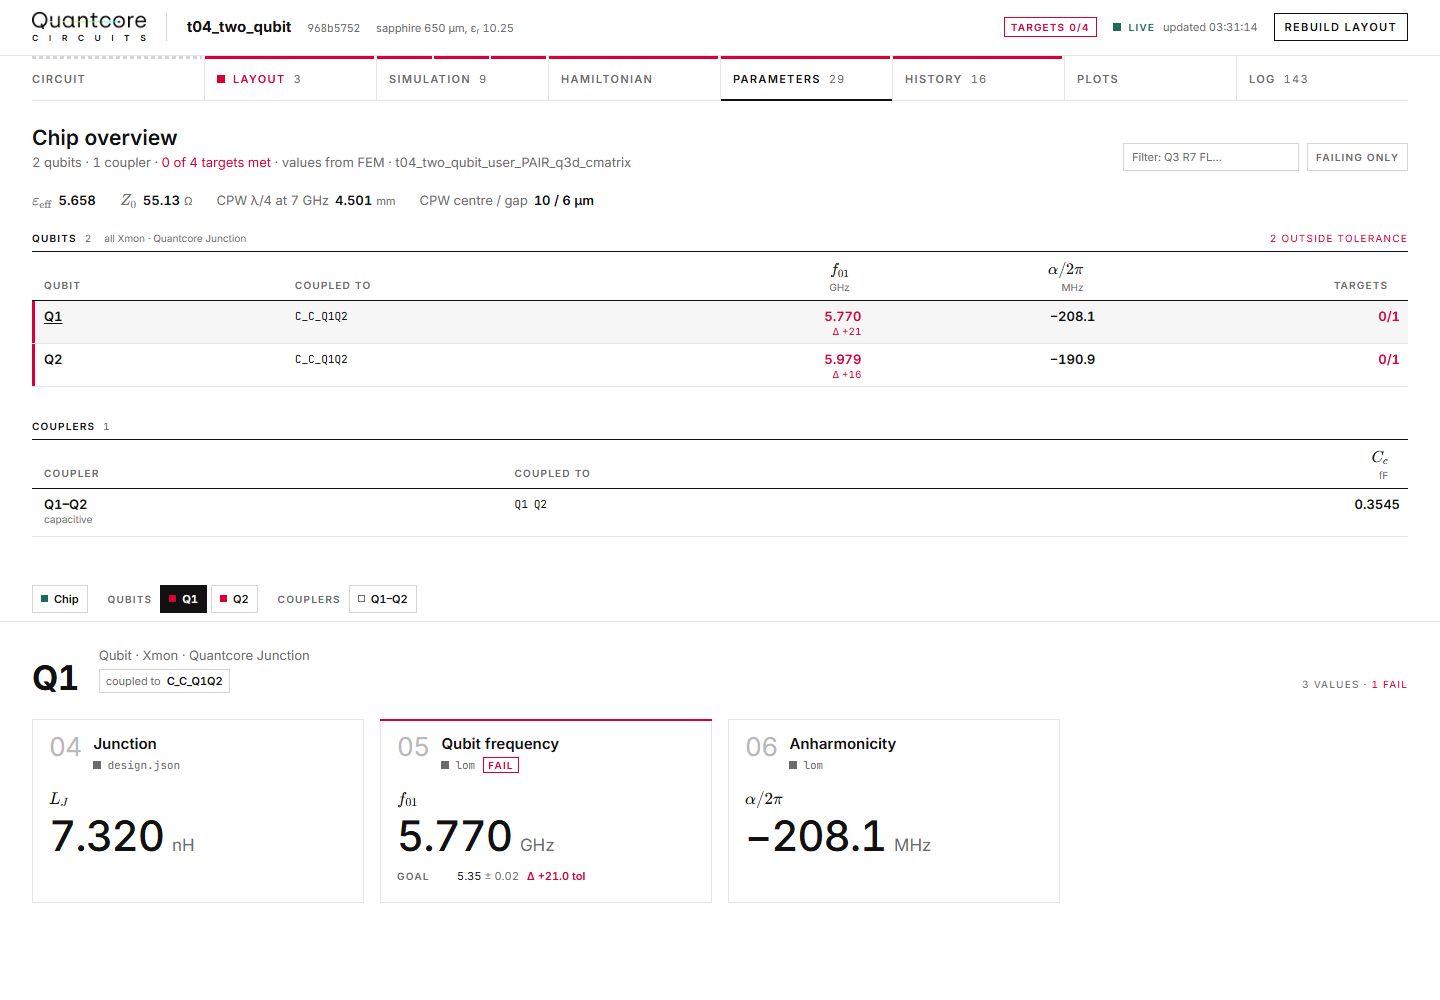
Run t04 (two Xmons). This is the last revision the tutorial tracked; it misses its targets (0 of 4 met).
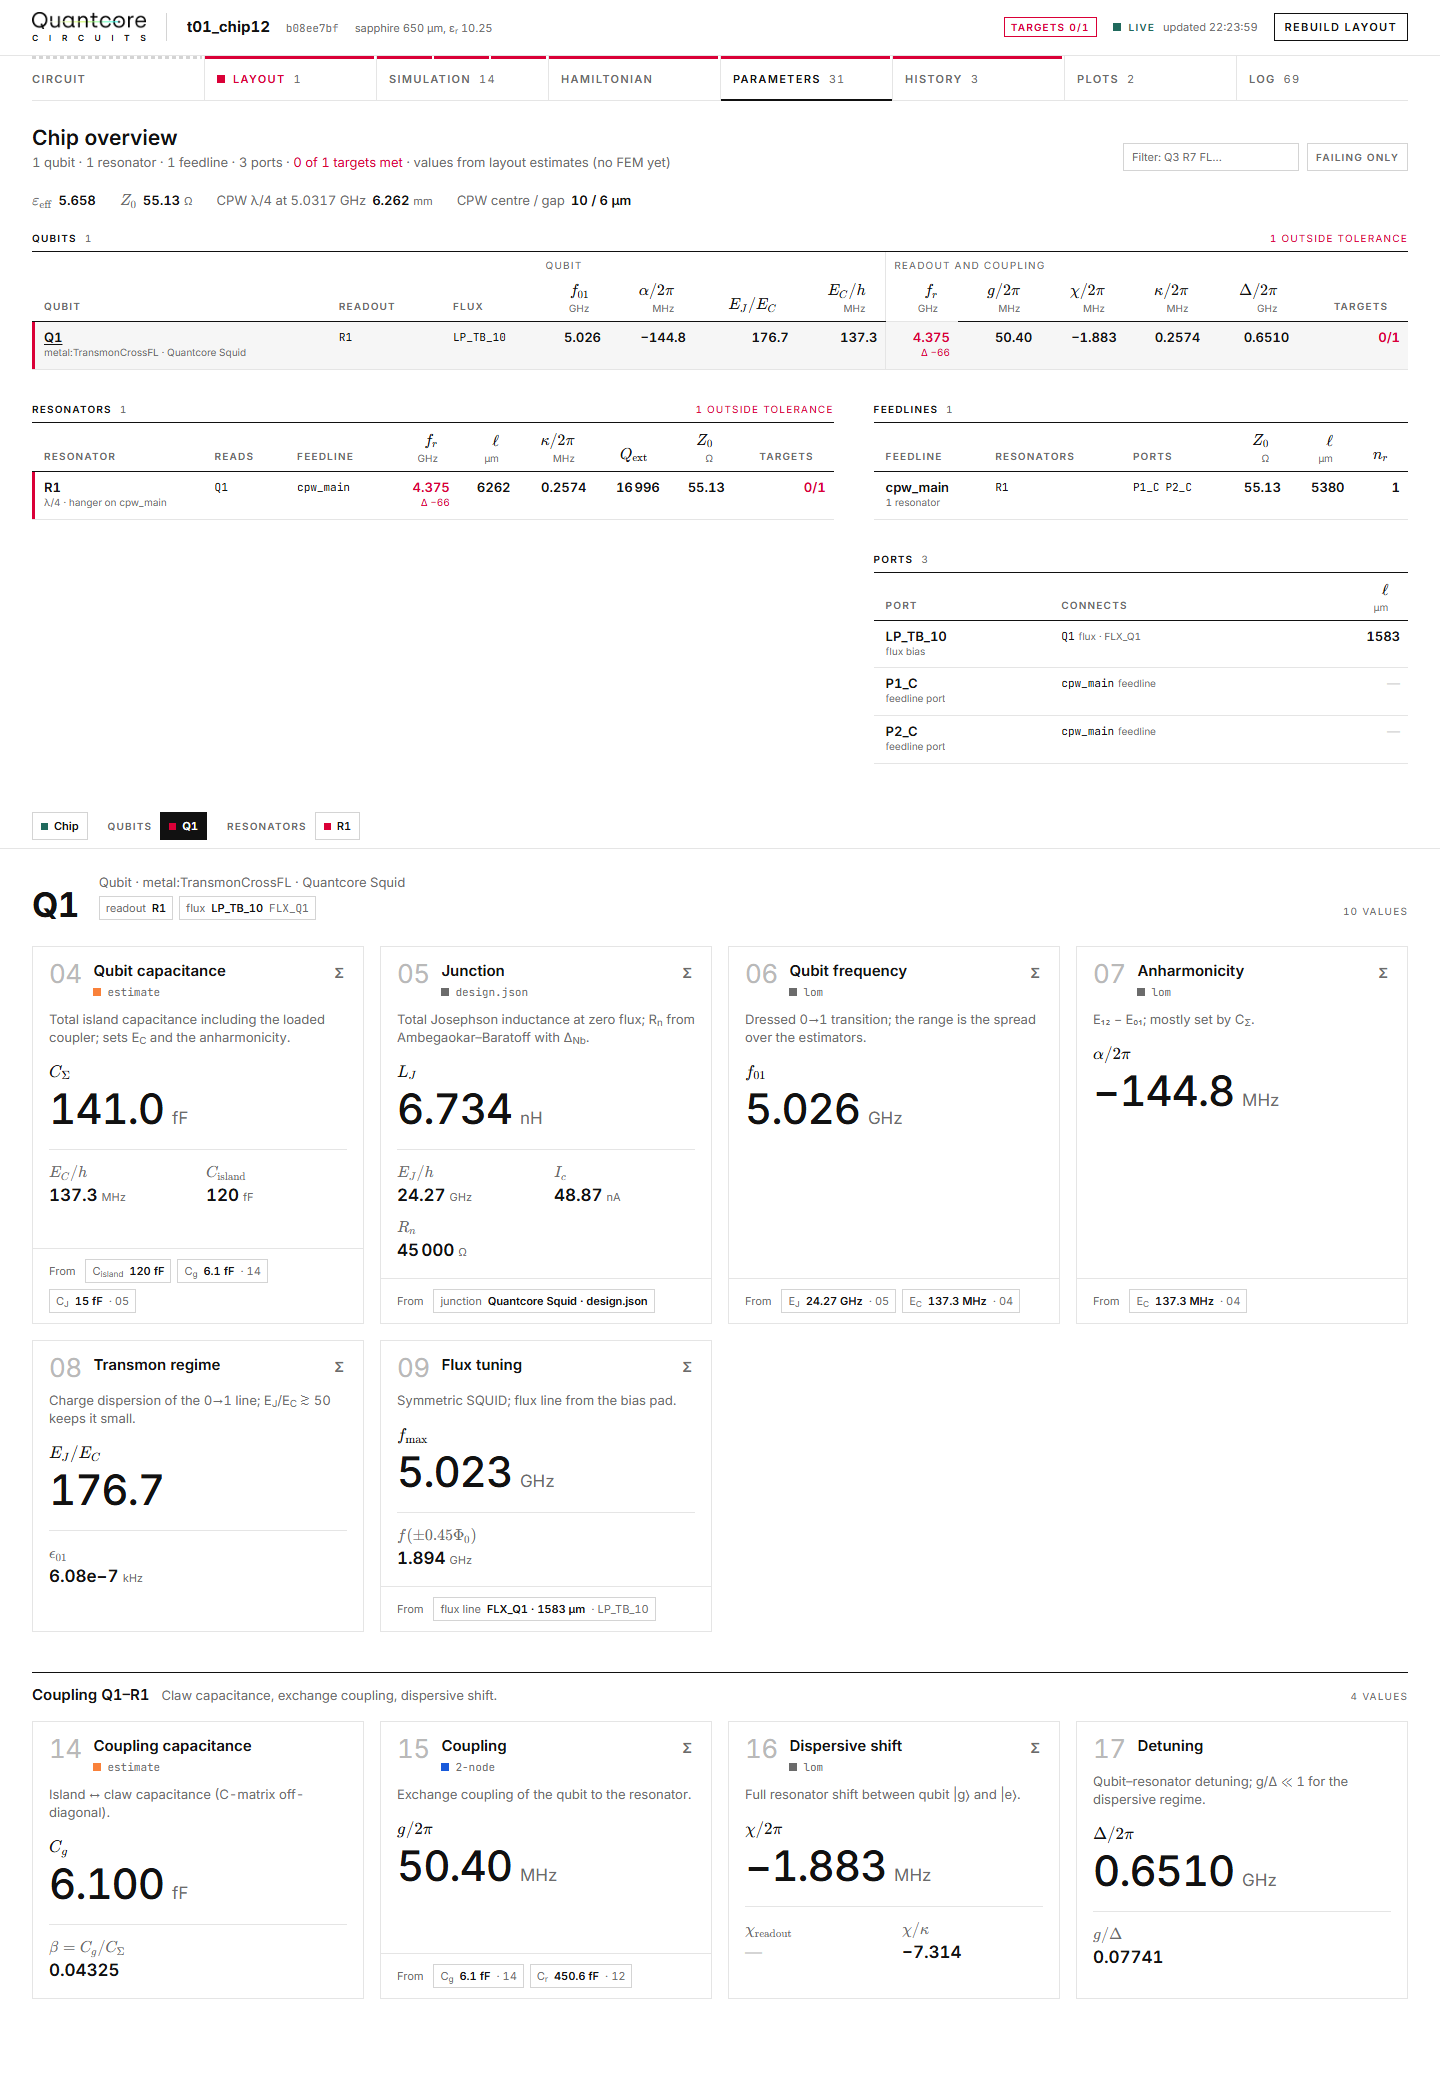
Run t01 (12-qubit chip): the same view for a larger chip, with the element filter.
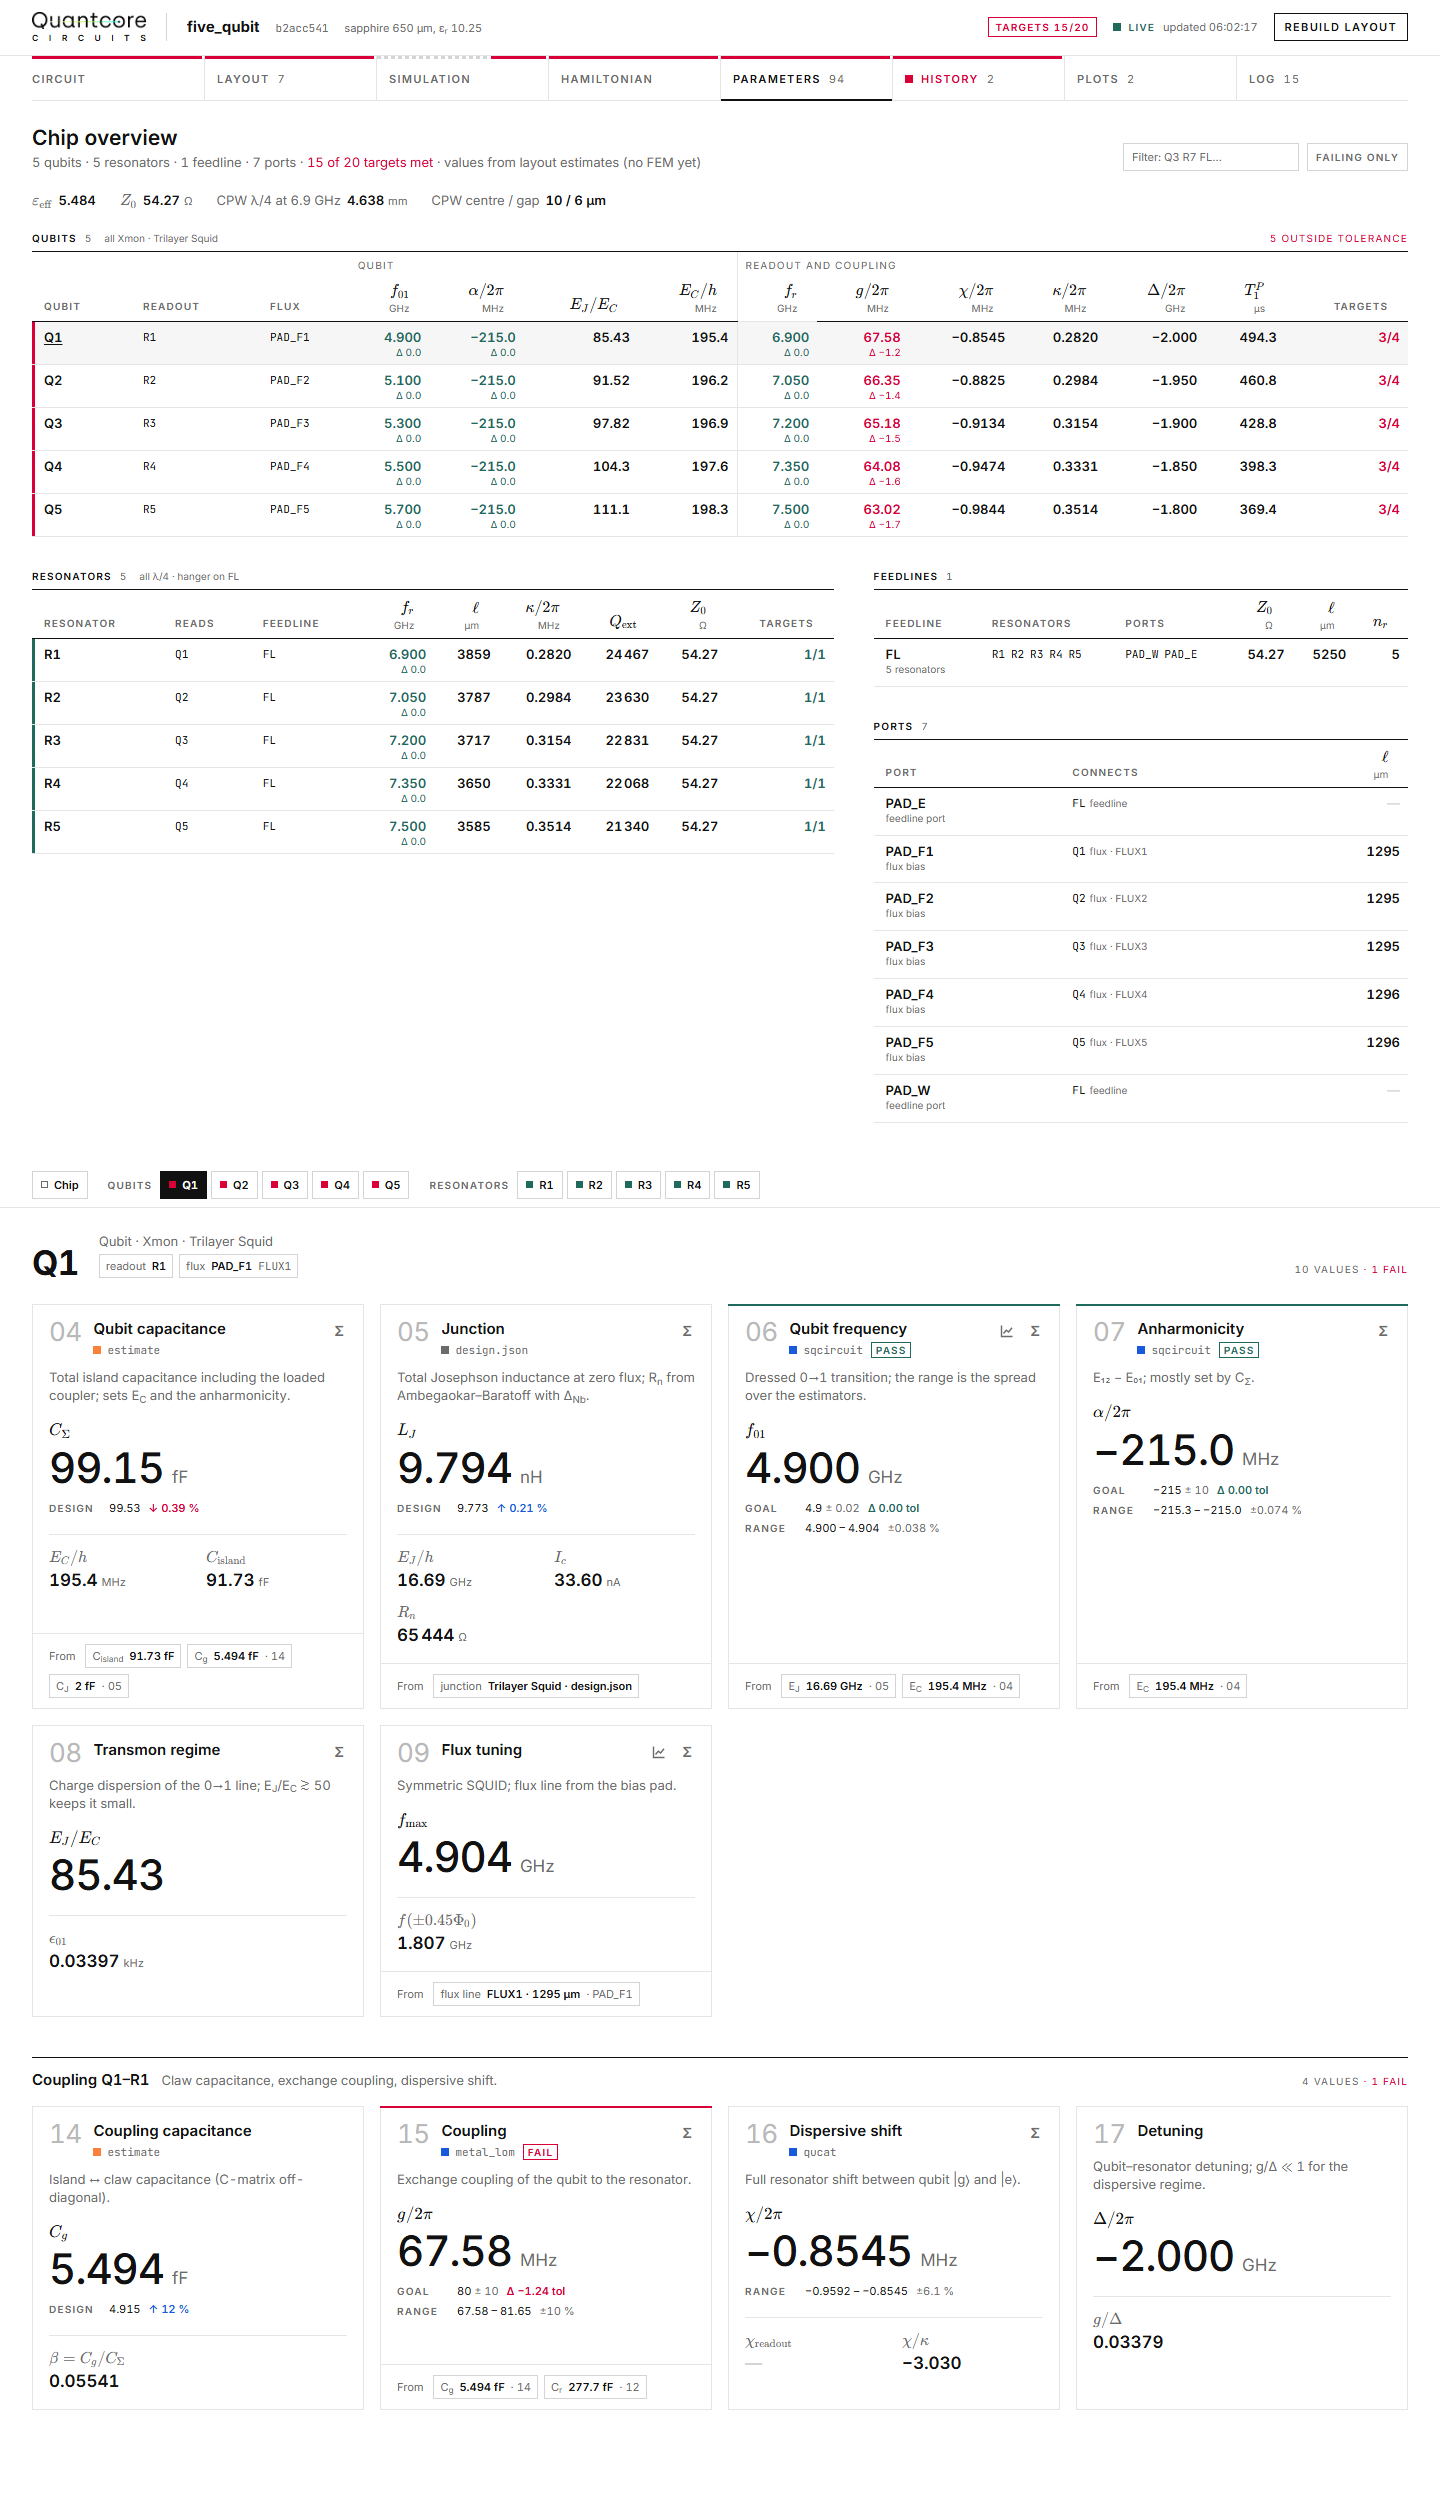
Run five_qubit (the IBM-style five-qubit chip).
Hamiltonian
The model (a transmon in the charge basis plus a lambda/4 resonator), its parameters, the dressed spectrum and the
estimator consensus table. Estimators that disagree by more than the tolerance are flagged. pyepr is the chosen value
where an eigenmode result exists.
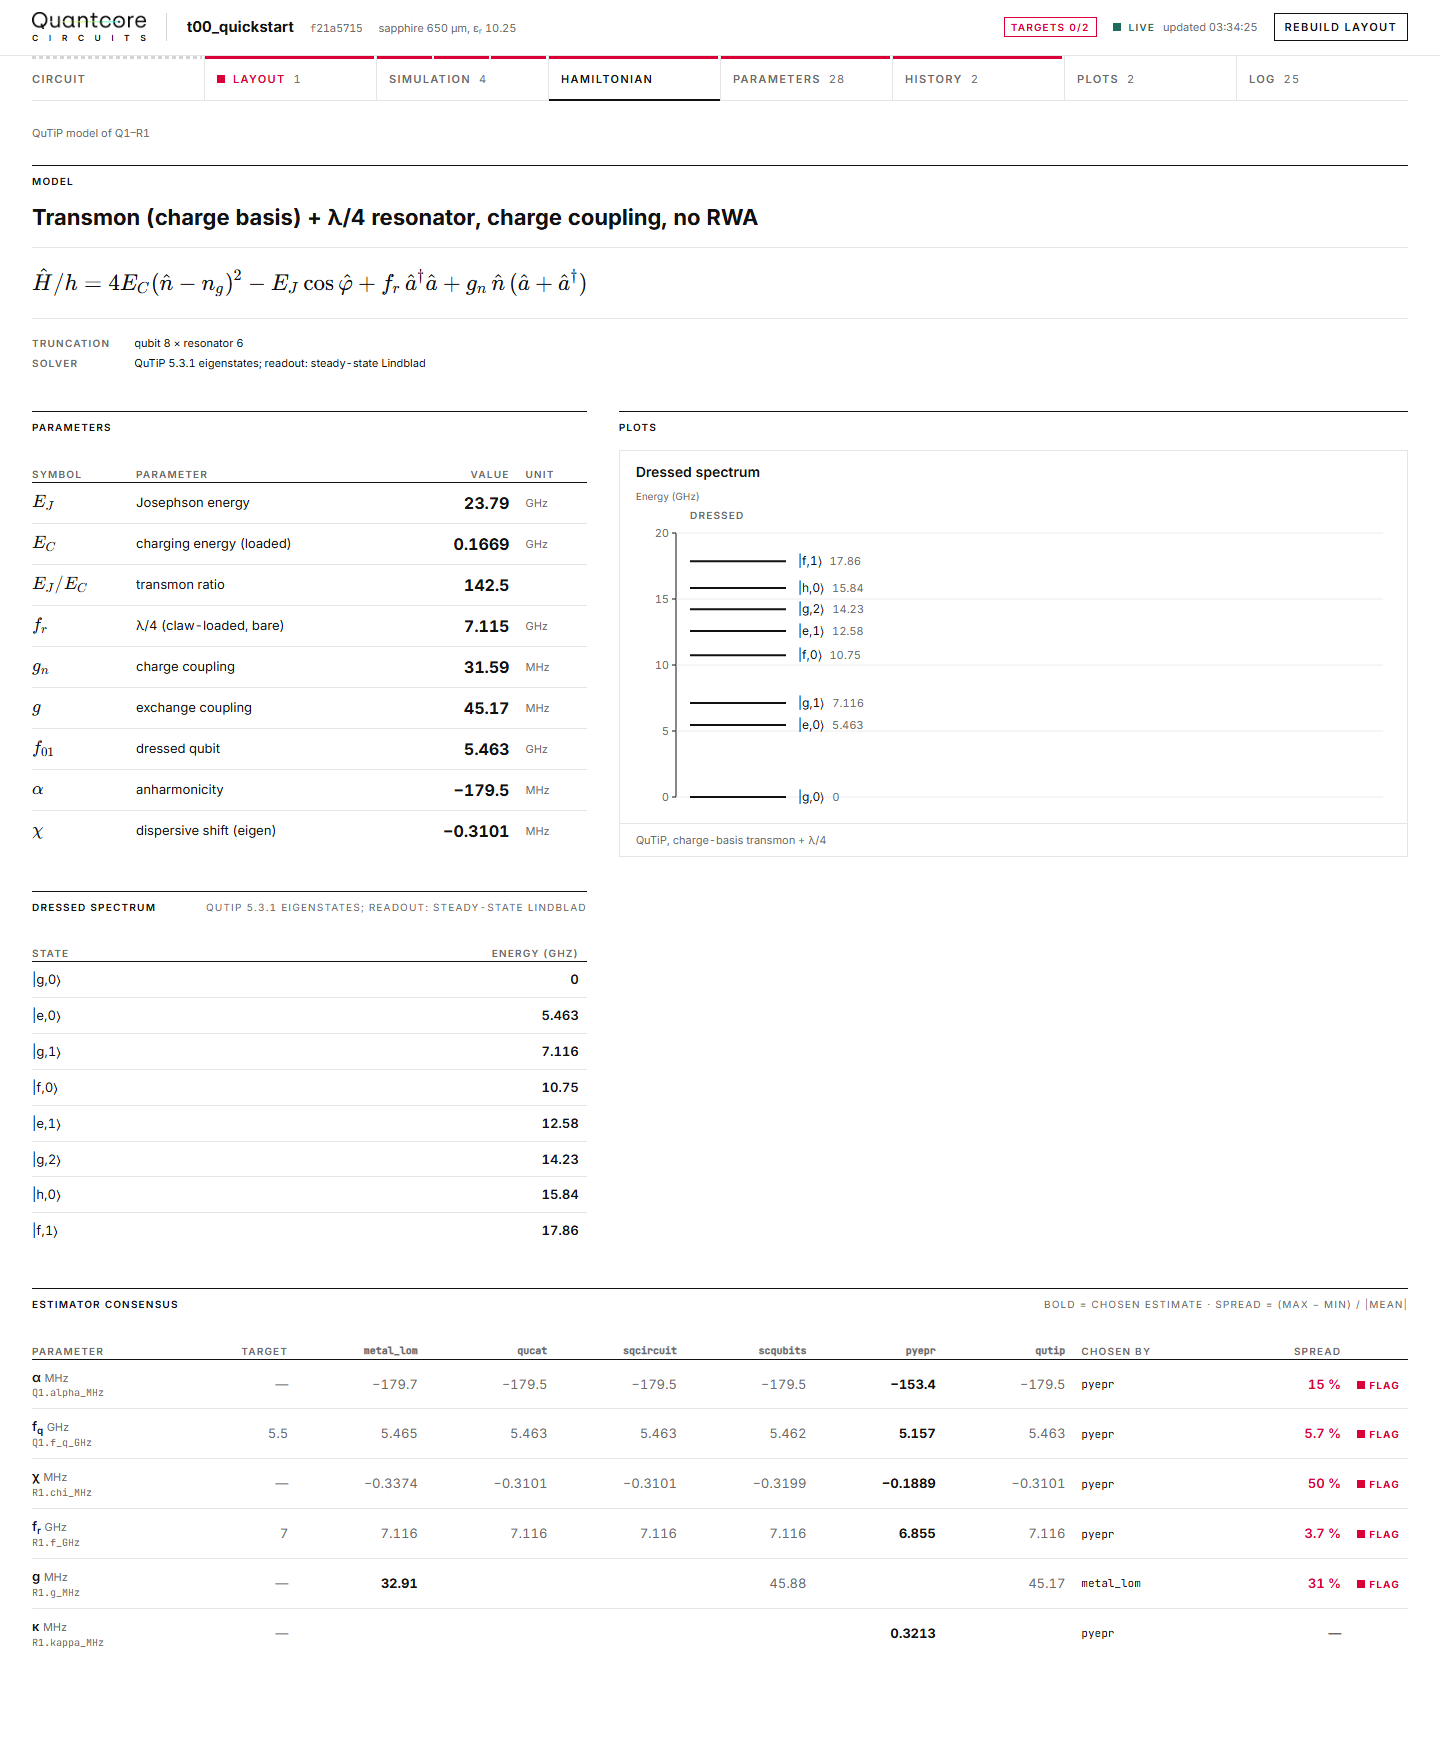
Run t00.
Simulation
The FEM jobs of the run with their state, then the estimate against the FEM value per branch with the difference in percent, and the Maxwell C-matrix of the newest Q3D job.
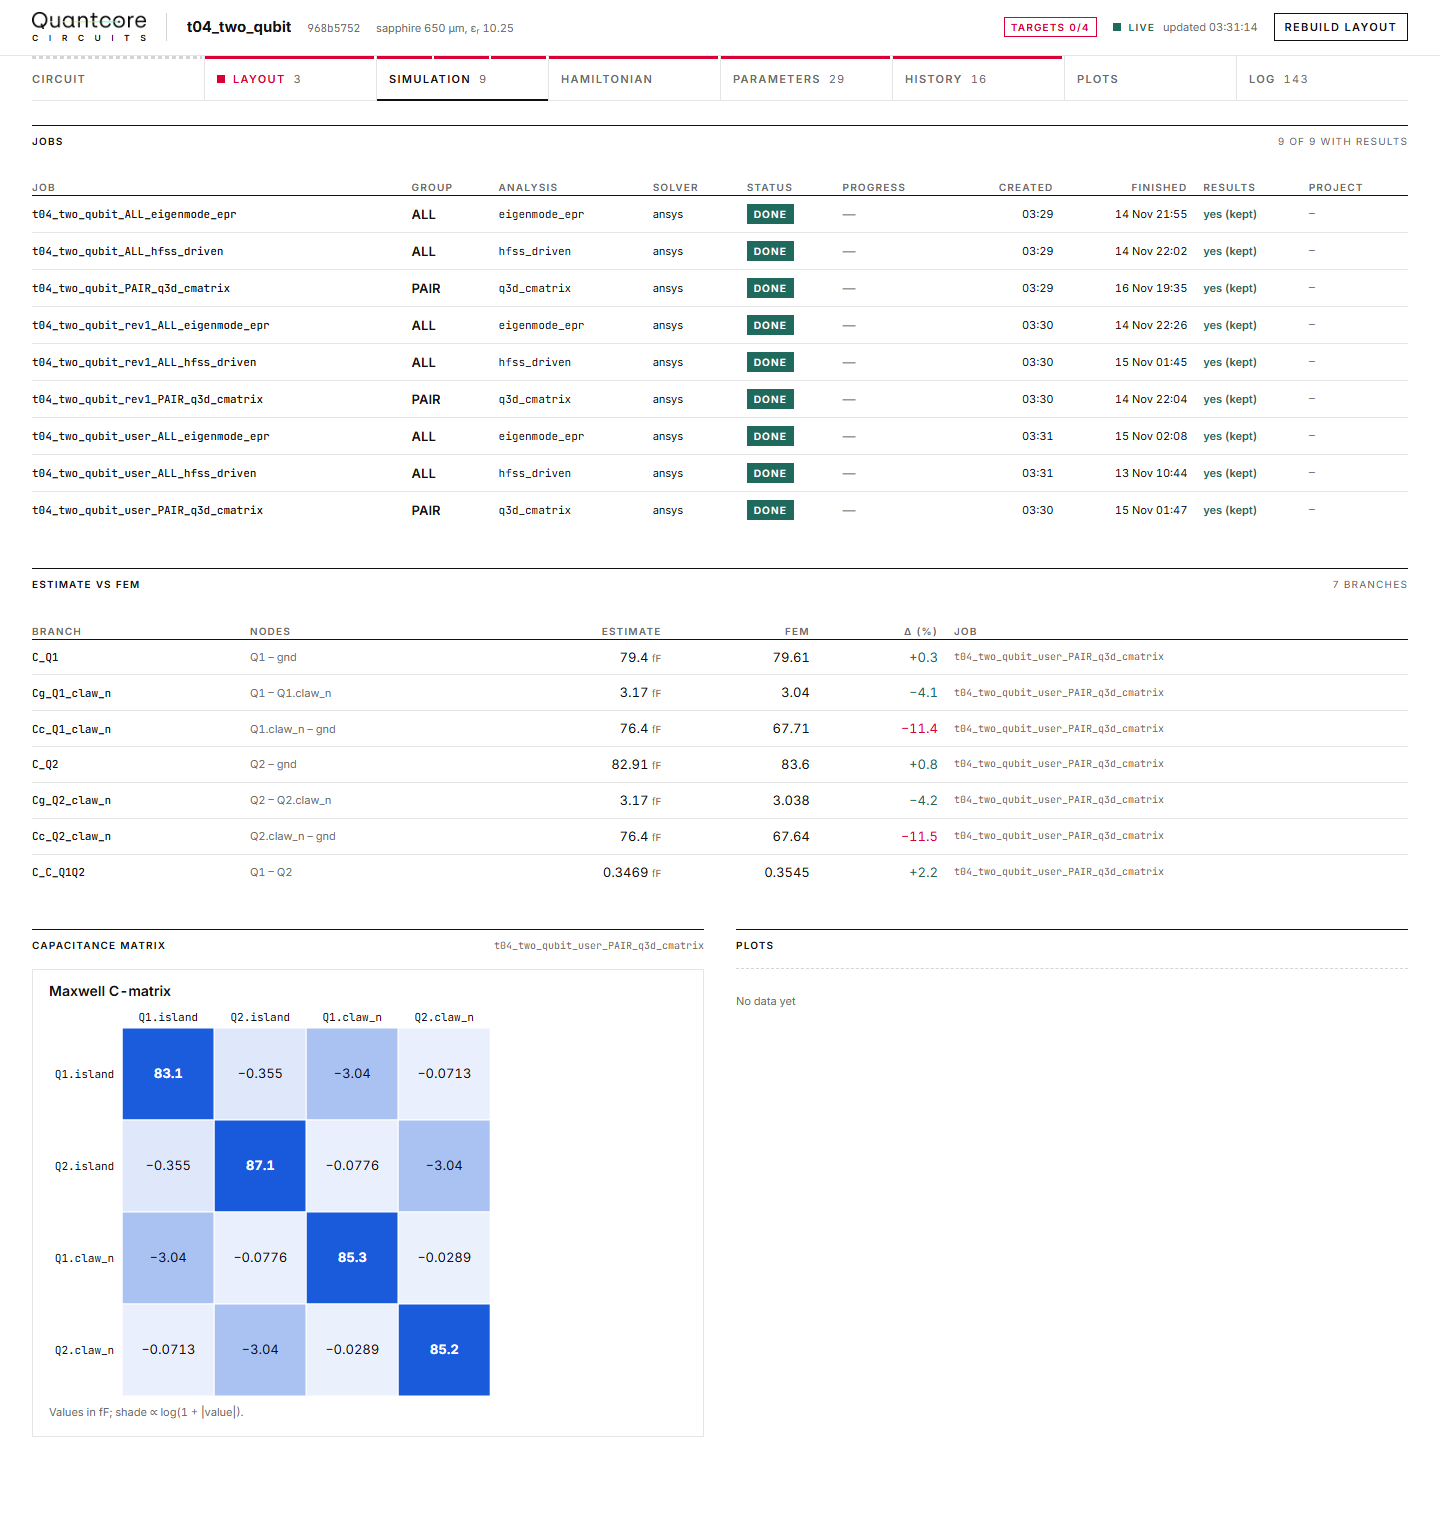
Run t04: nine kept FEM jobs (all DONE, results kept, finished 13-16 Nov).
History
The targets with their current value, the residual norm per feedback iteration (log scale, tolerance dashed) and the iteration table with the knobs and residuals.
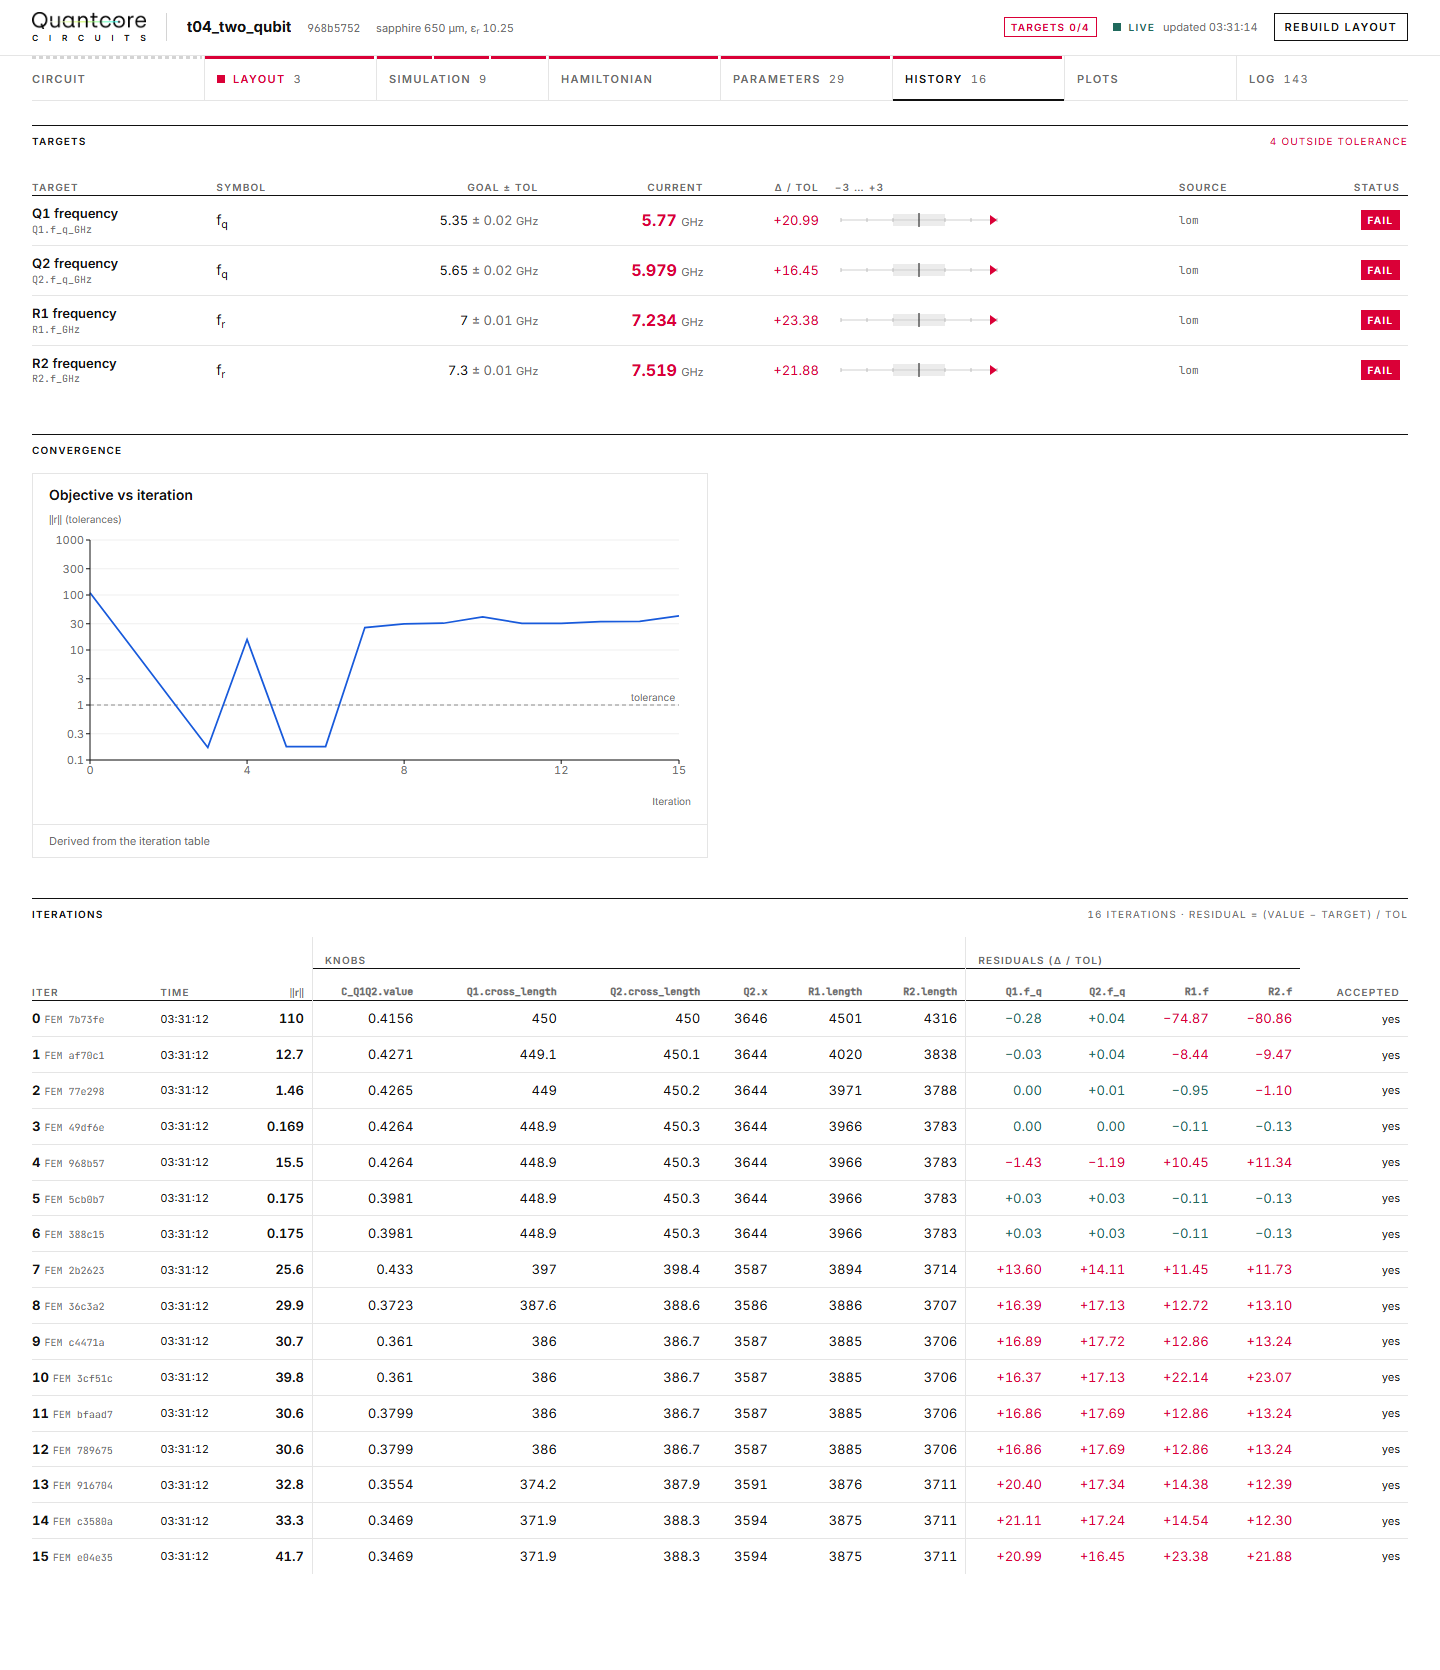
Run t04. The residual does not settle below tolerance in this tracked run.
Plots
Estimator values per parameter, and the deviation from the chosen value.
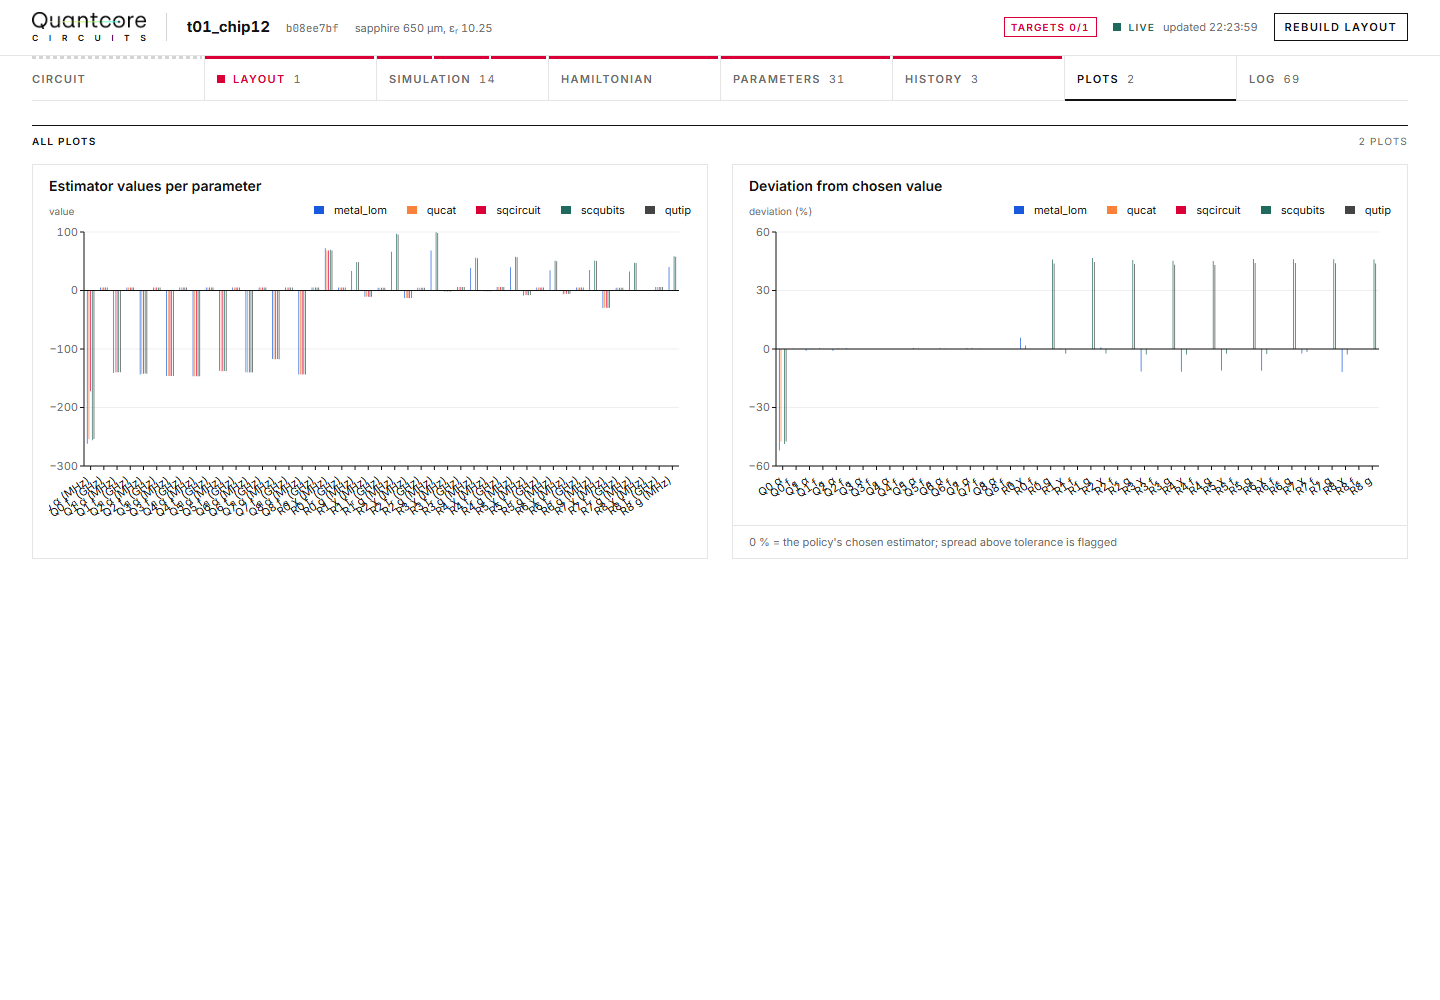
Run t01: all 12 qubits.
Circuit
The schematic of the lumped model (island, junction, coupling capacitor, claw, lambda/4, hanger kappa, 50 ohm port) next
to the branch table with value, source (fem, estimate) and node list.
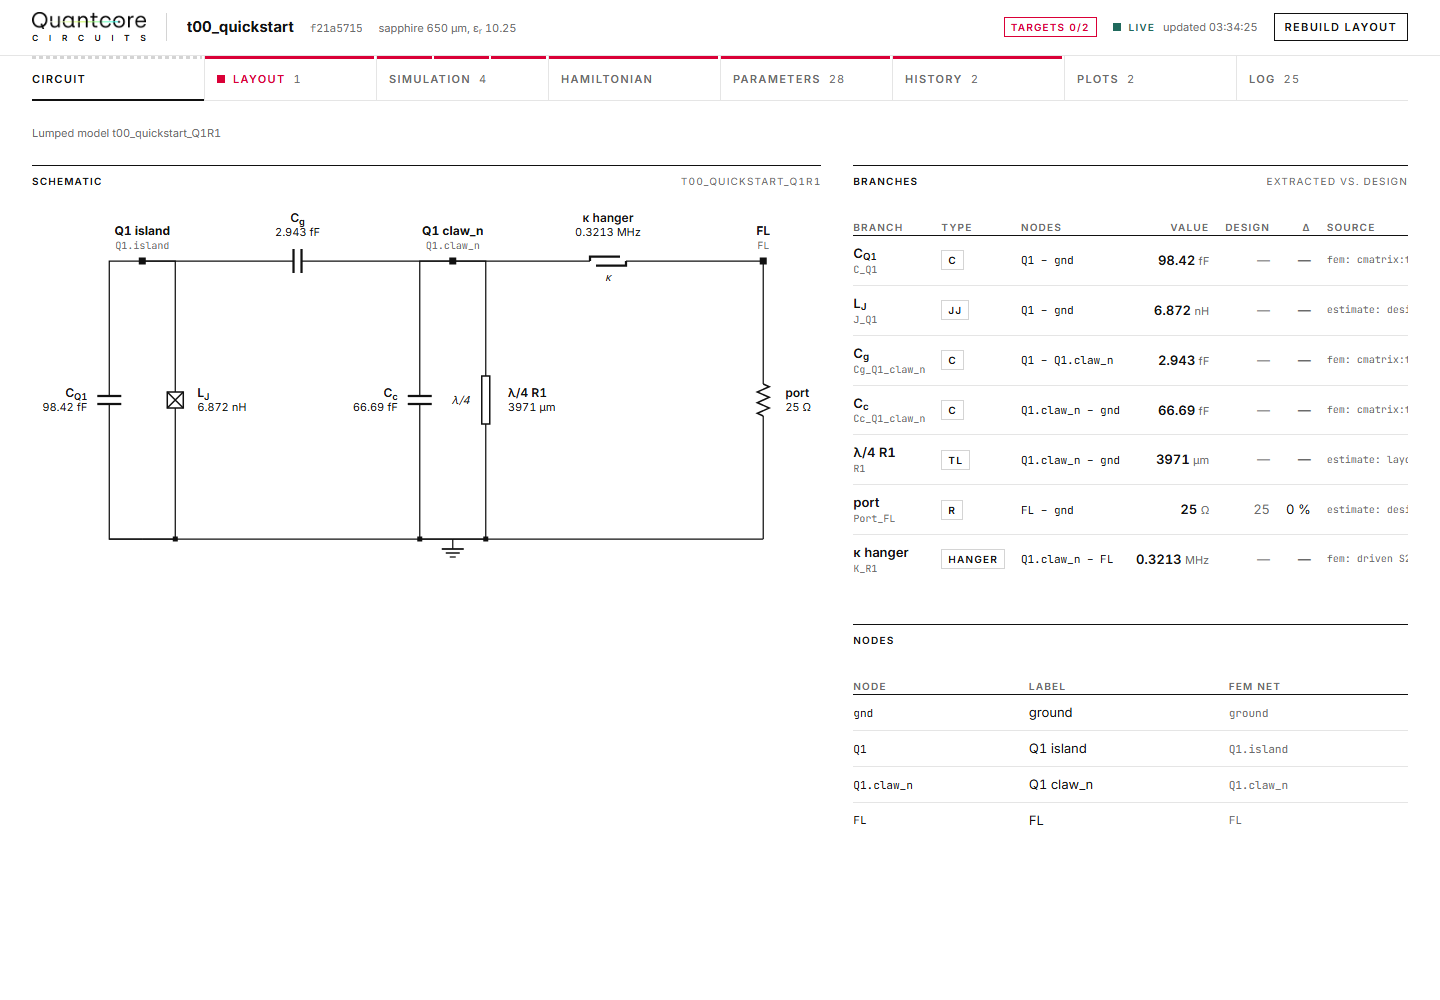
Run t00.
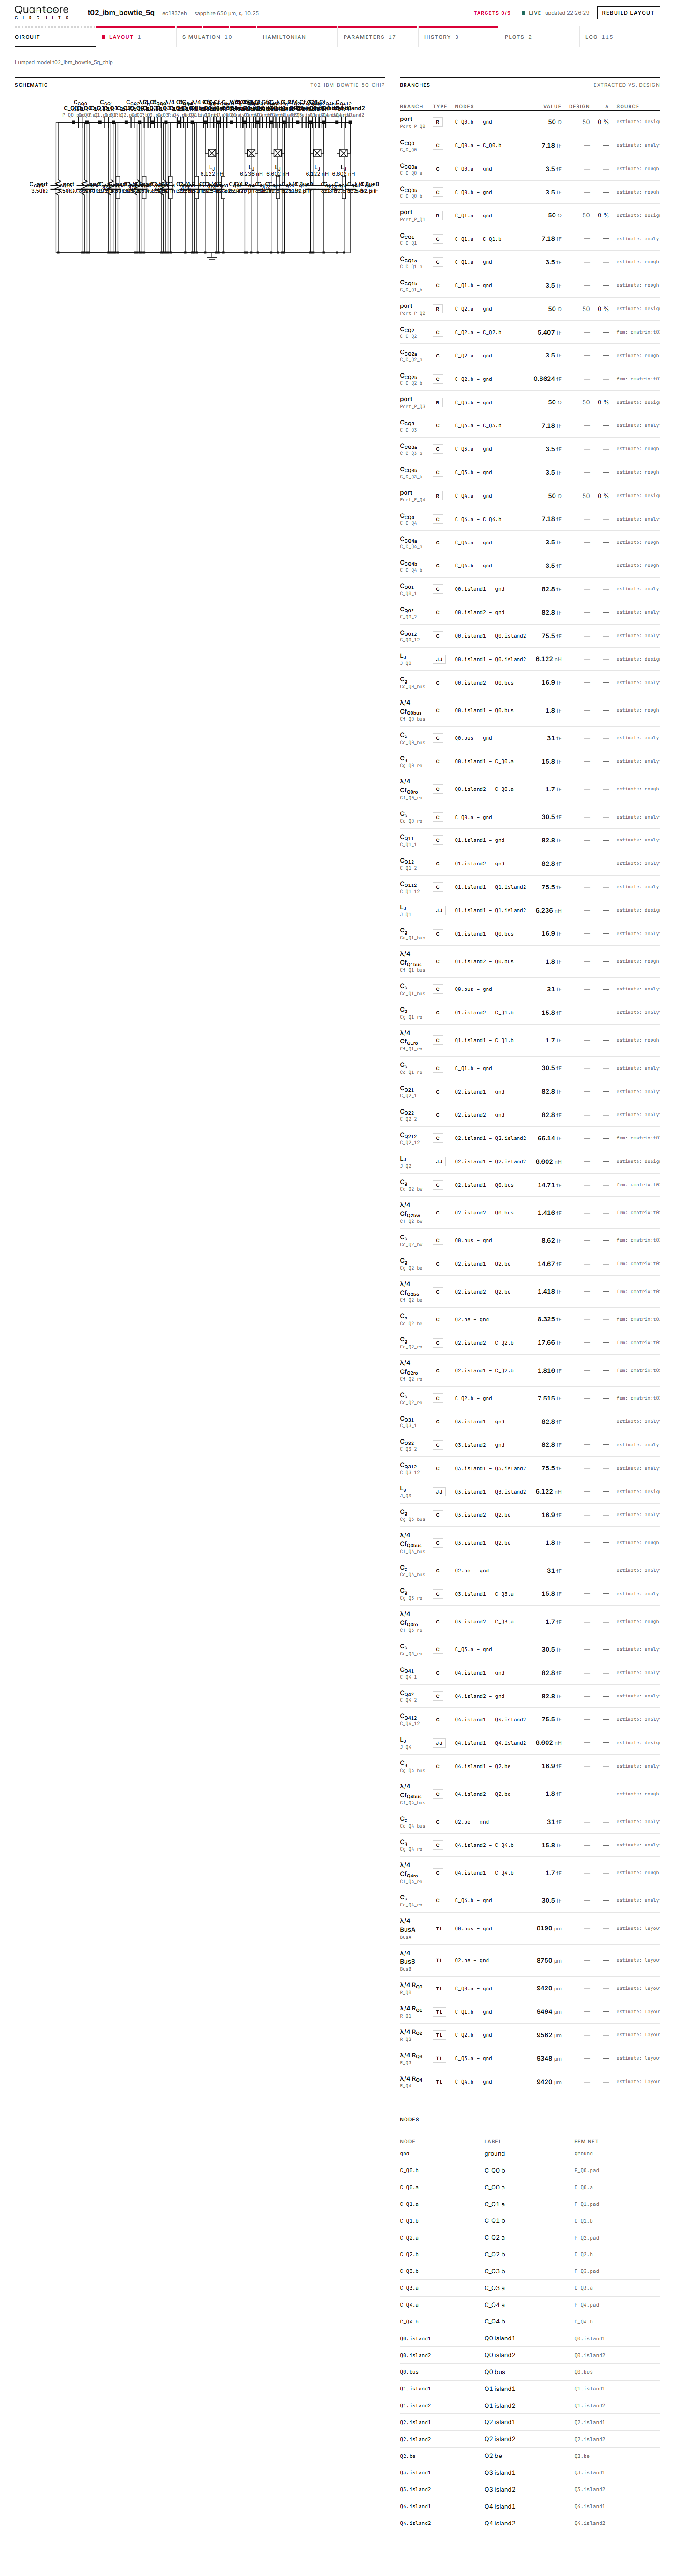
Run t02 (five qubits and two buses): the same view of a bigger chip.
Layout
KLayout captures (headless renders) from each revision. The dashboard does not draw the layout itself.
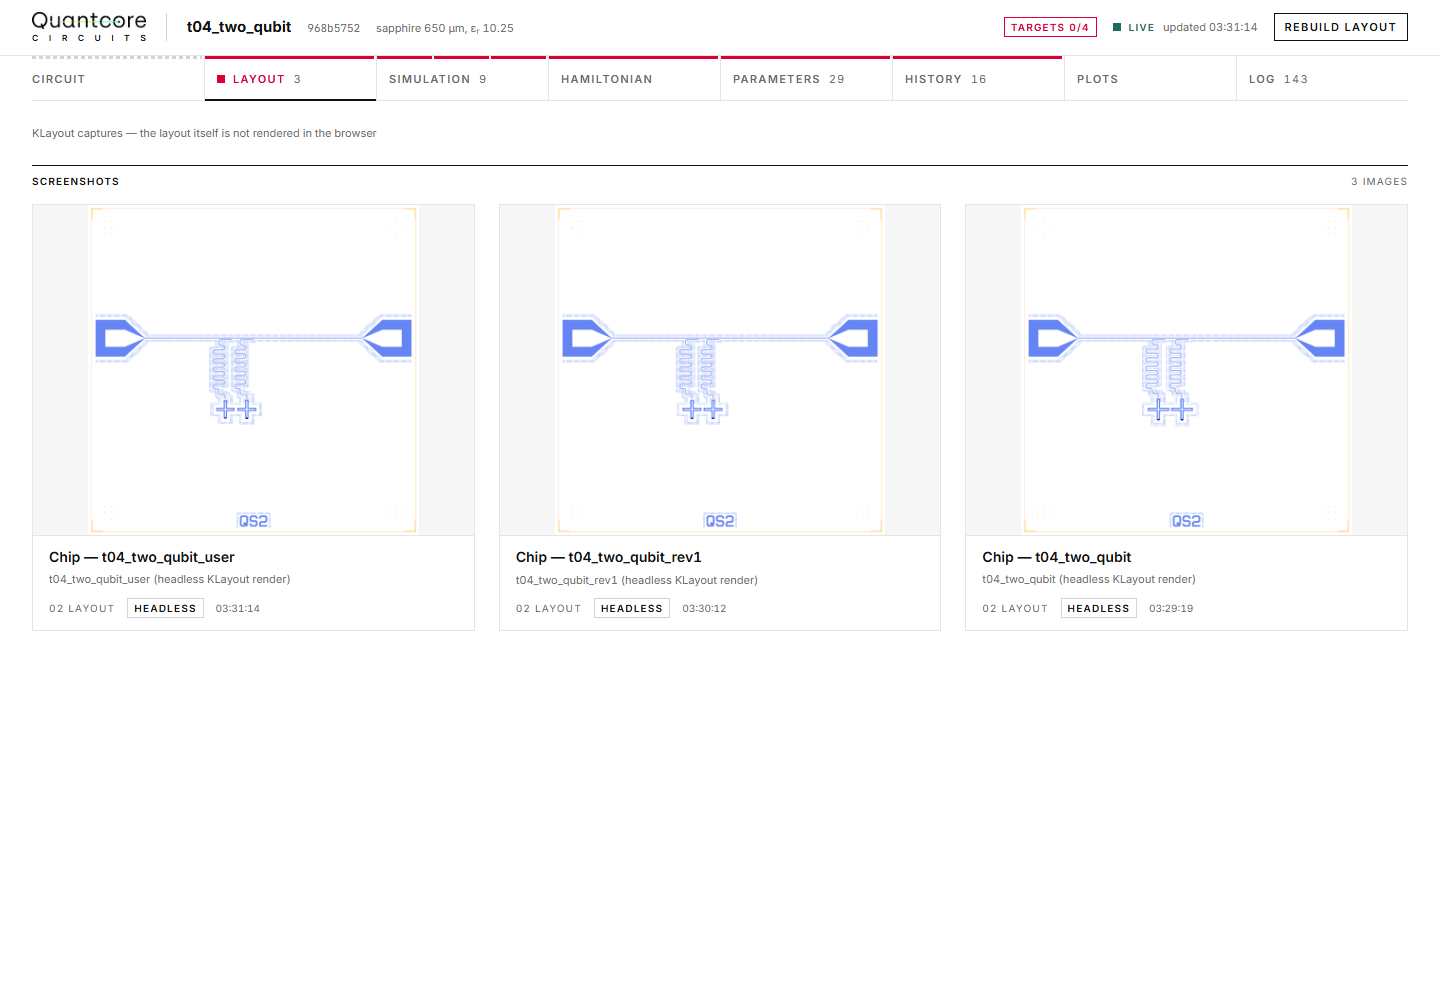
Run t04.
Log
The steps of the run in order, with their time and any error.
Limits
Fab is not a dashboard step. Per-instance values are shown here only, not on hover in KLayout.
The render and optimiser marks with a real AEDT run were unit-tested, and the chain check used them live once (2026-11-13).
q1_r1_first_runandq1_r1_loopstart AEDT whenever it is installed, whateverRUN_FEMsays.Verified on every tutorial and the
q1_r1notebook (2026-11-13);t04was served again on 2026-11-18. Tests:test_dashboard_tracking.py(27) andtest_codesign_track.py(7).
See the flow for where the dashboard sits in the loop and the status page for what is verified.