Plugin tour
This page shows what each part of the plugin looks like, with a screenshot of every window and dialog. Read it to
know what to expect before you draw, or to find the name of a dialog. The plugin is the GUI front end of
design.json: every action edits design.json, calls qcc, and draws the result. How to install it is on the
plugin page; the Q1 + R1 tutorial walks through a first chip.
The window
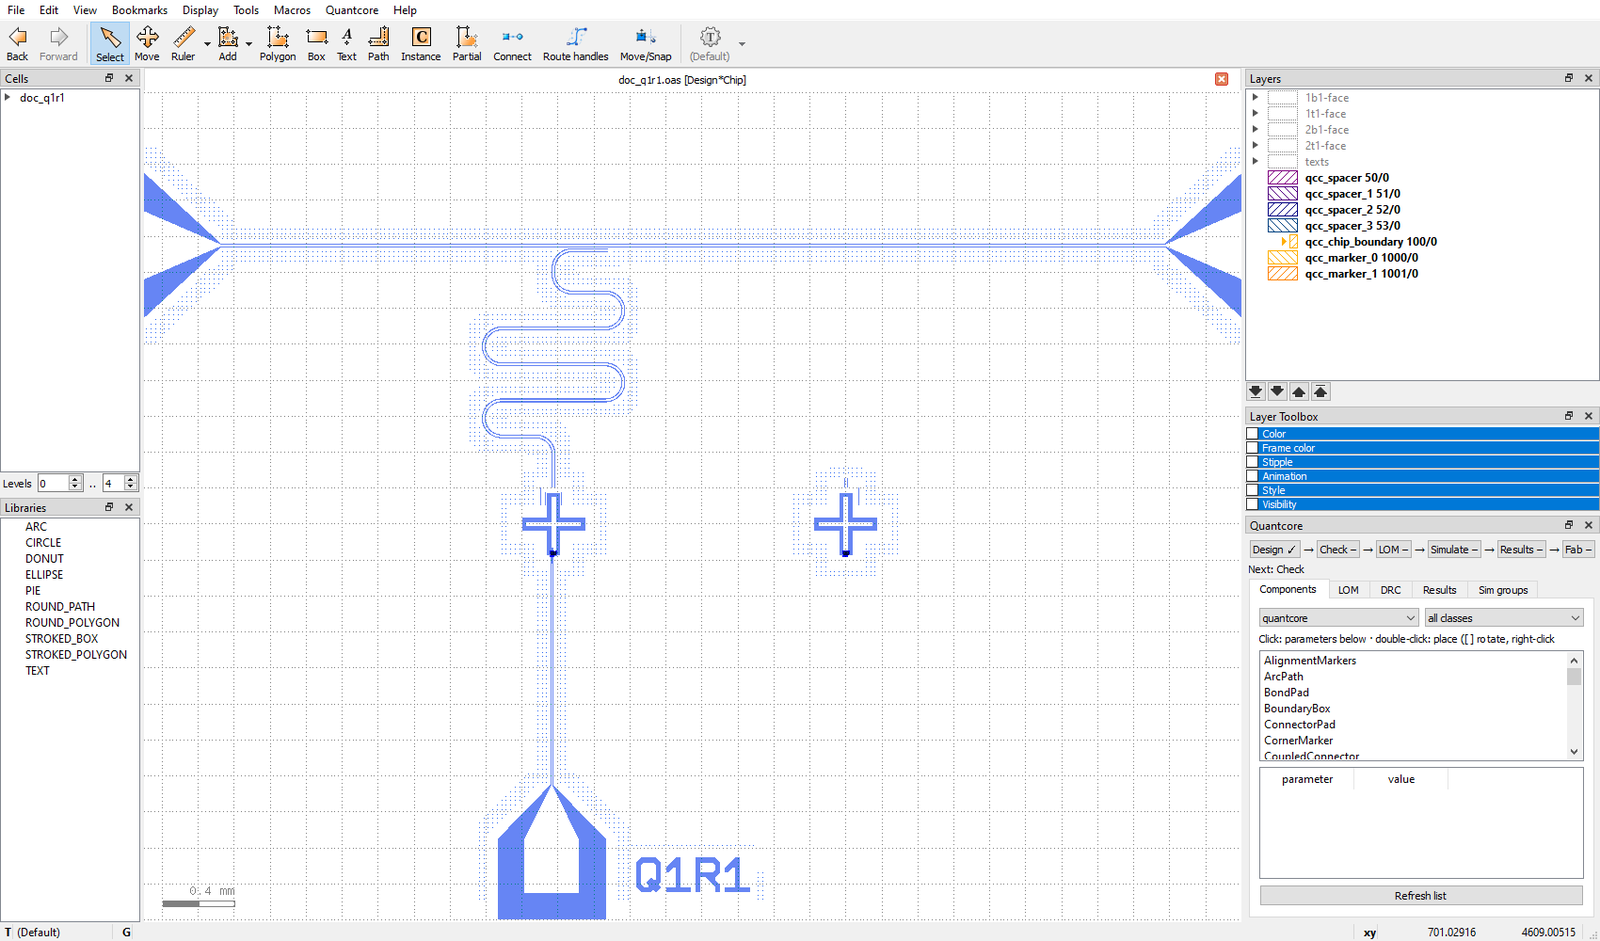
KLayout with the plugin. Top: the Quantcore menu and the toolbar tools Connect, Route handles and Move/Snap.
Right: the Quantcore panel with the Flow strip (Design, Check, LOM, Simulate, Results, Fab) and the tabs Components,
LOM, DRC, Results, Sim groups. The die shown is a scratch copy of examples/q1_r1_feedline.json with one extra,
unconnected Xmon.
The Flow strip has one button per step. A mark shows the state: done, done but out of date or with issues, or not done yet. The line under it names the next step.
Components tab
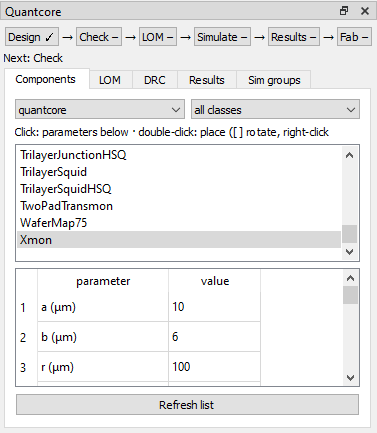
The Components tab. The first drop-down picks the library (quantcore, kqc, metal, all), the second the class (qubit, resonator, launcher, …). Click a cell to see its parameters; double-click to place it.
The cell pages under Components show the pins of every cell.
Check and the DRC tab
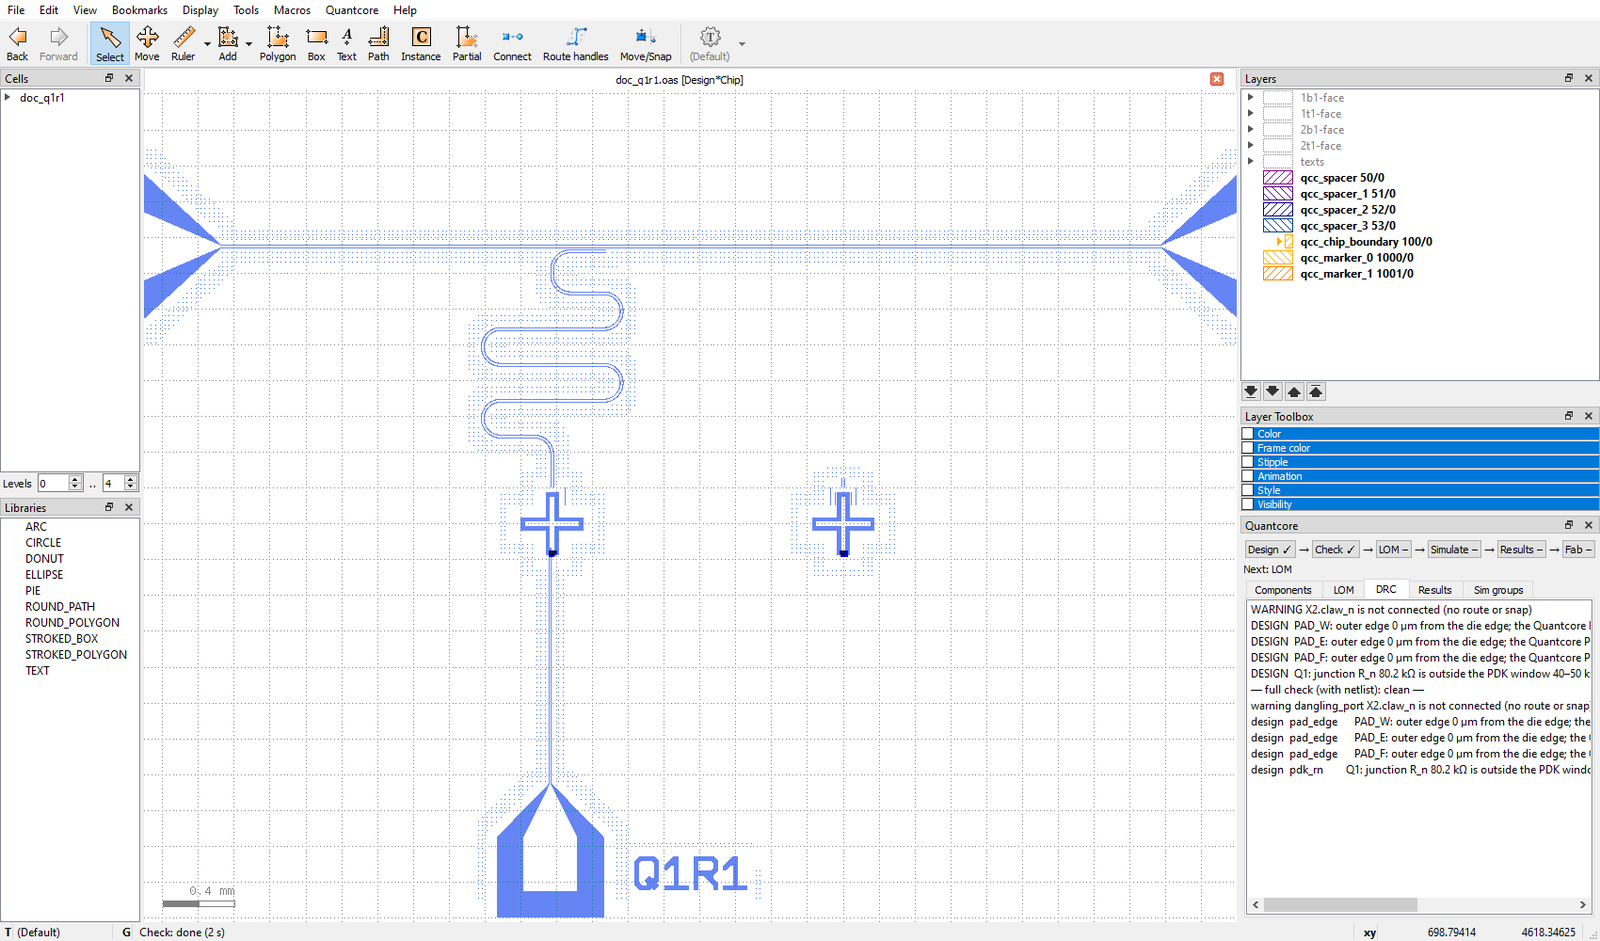
After Check (Ctrl+Shift+D): the DRC tab lists errors, warnings and PDK design warnings. Here X2.claw_n is a dangling
port (the extra Xmon has no route), and the scratch pads sit at the default position, so pad_edge design warnings
appear (Quantcore > Check > Fix pad edge warnings sets edge = "auto").
Clicking a DRC line zooms to its marker. Rules are listed on routing and DRC.
Connect, Route handles and failed routes
The Connect tool snaps to ports, lines and hangers and turns the path you click into a route. Route handles shows a route’s nodes and an insert handle on every straight.
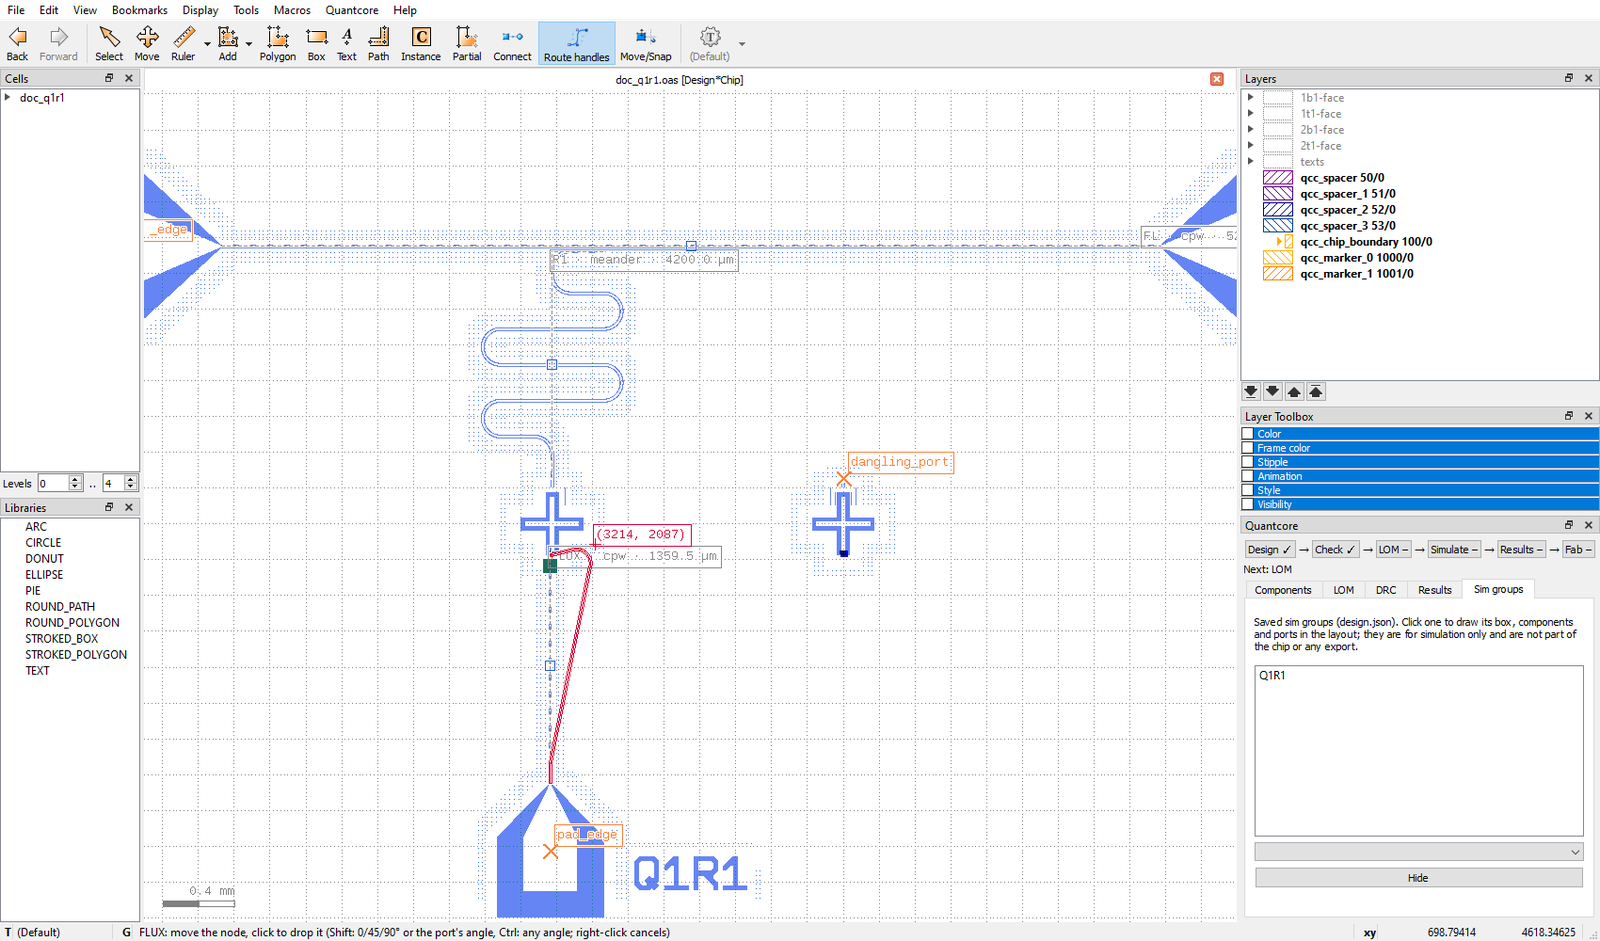
Route handles, with the node of the FLUX line picked up: the red path follows the pointer, the box shows its
coordinate, and the status bar says how to drop it (Shift: 0/45/90 degrees, Ctrl: any angle, right-click cancels).
The plugin builds with qcc build --keep-going. A route that cannot be built does not stop the design:
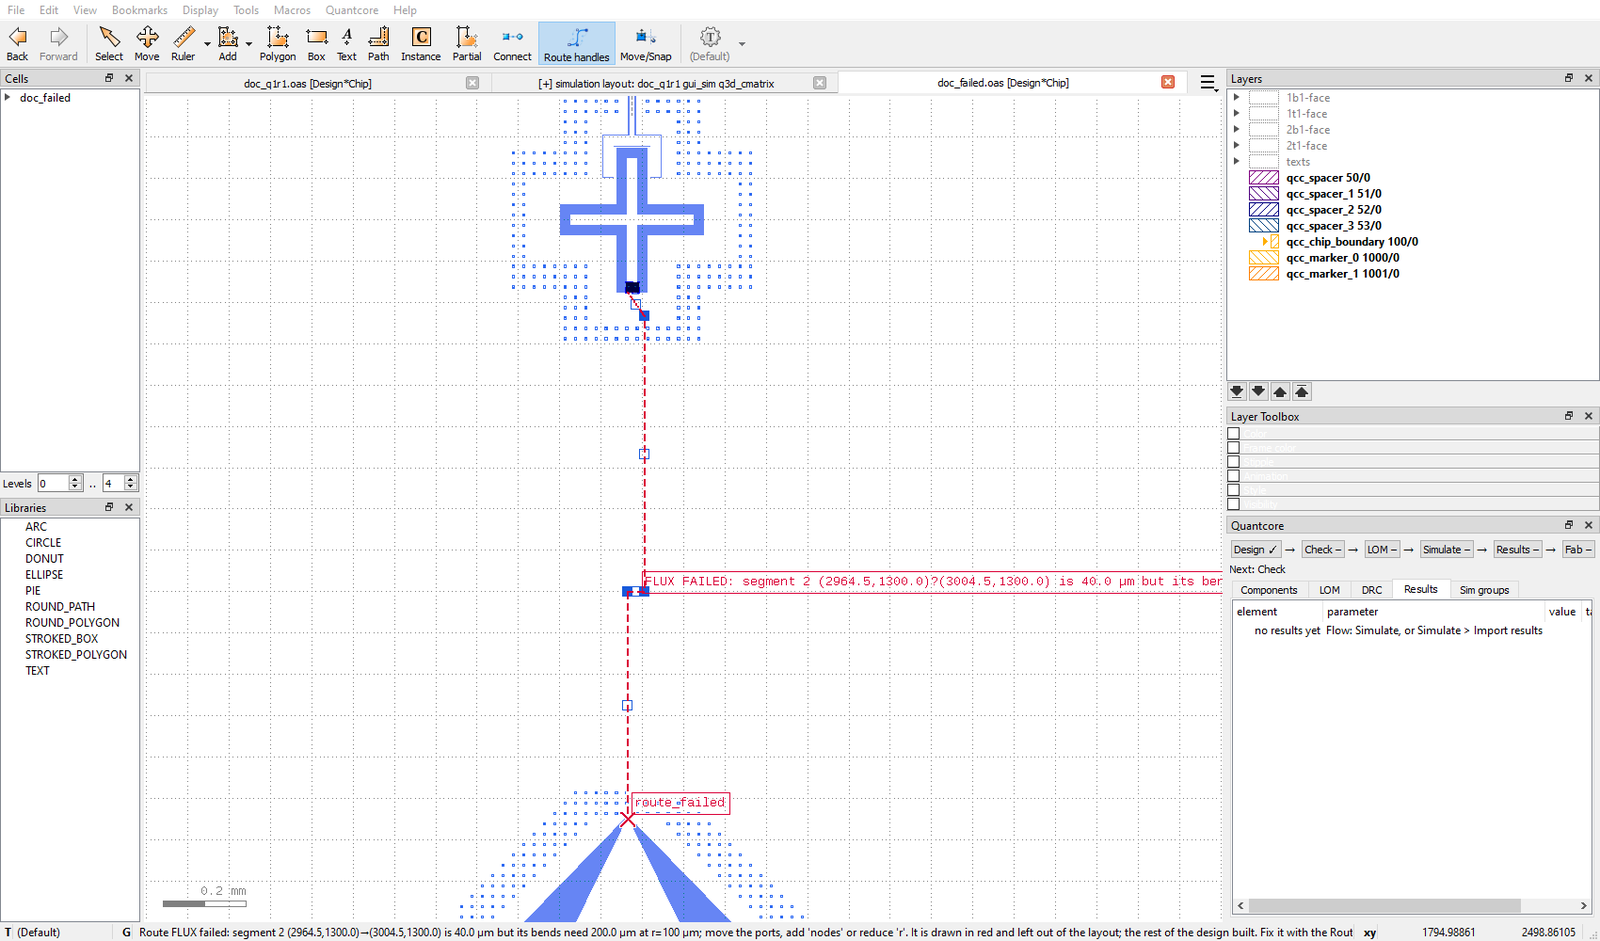
A failed route. The FLUX line has a leg of 40 µm between two bends that need 200 µm. It is left out of the layout,
drawn dashed in red with its nodes, and the reason is written next to it (“segment 2 … is 40.0 µm but its bends need
200.0 µm at r=100 µm”).
Rotation and snapping while placing:
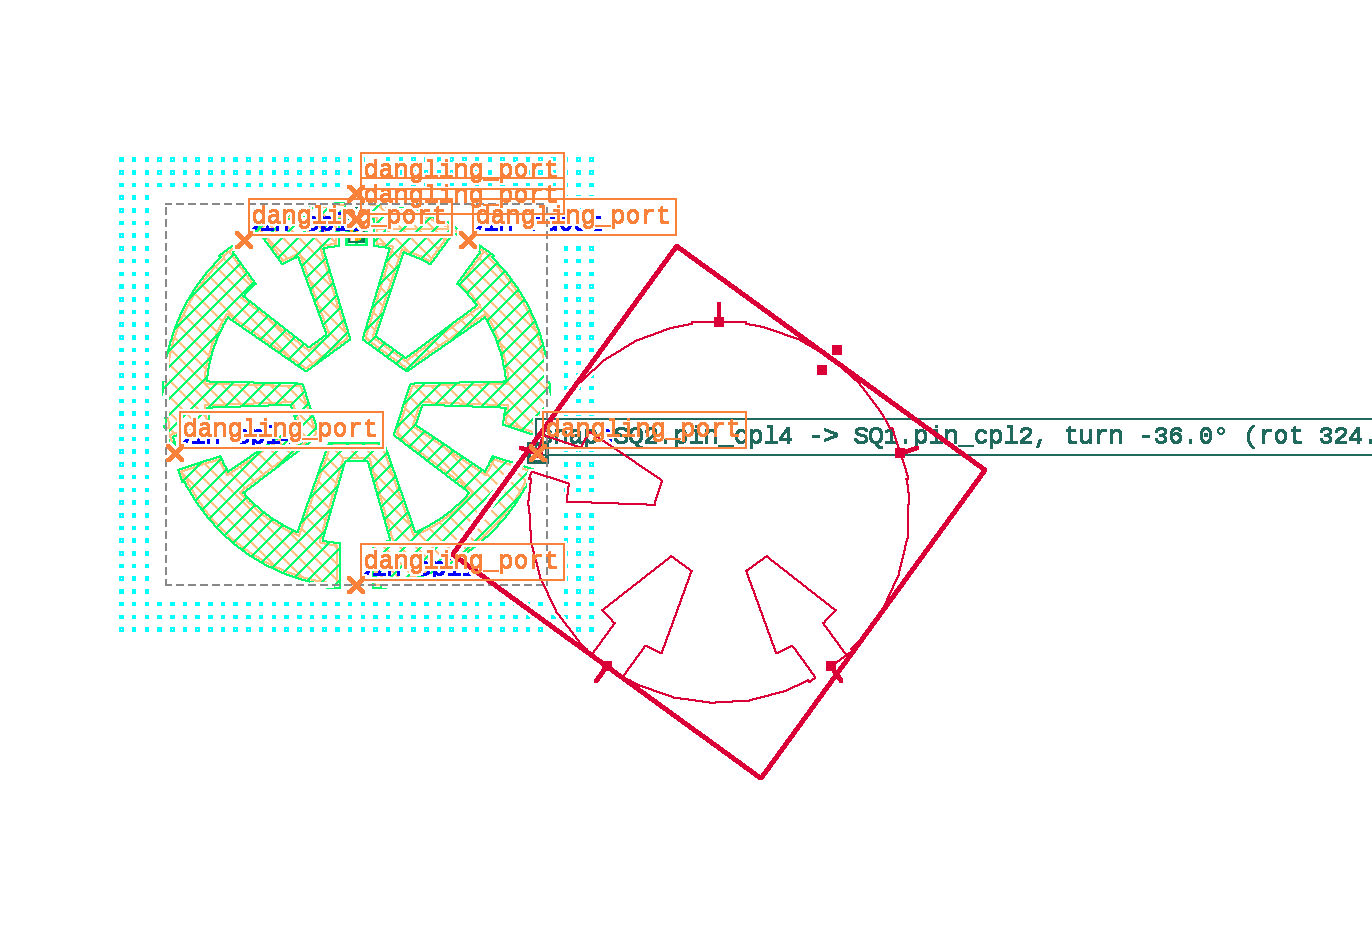
Move/Snap with a rotation preview: [ and ] rotate, the component snaps to a port at the rotated angle.
Dialogs
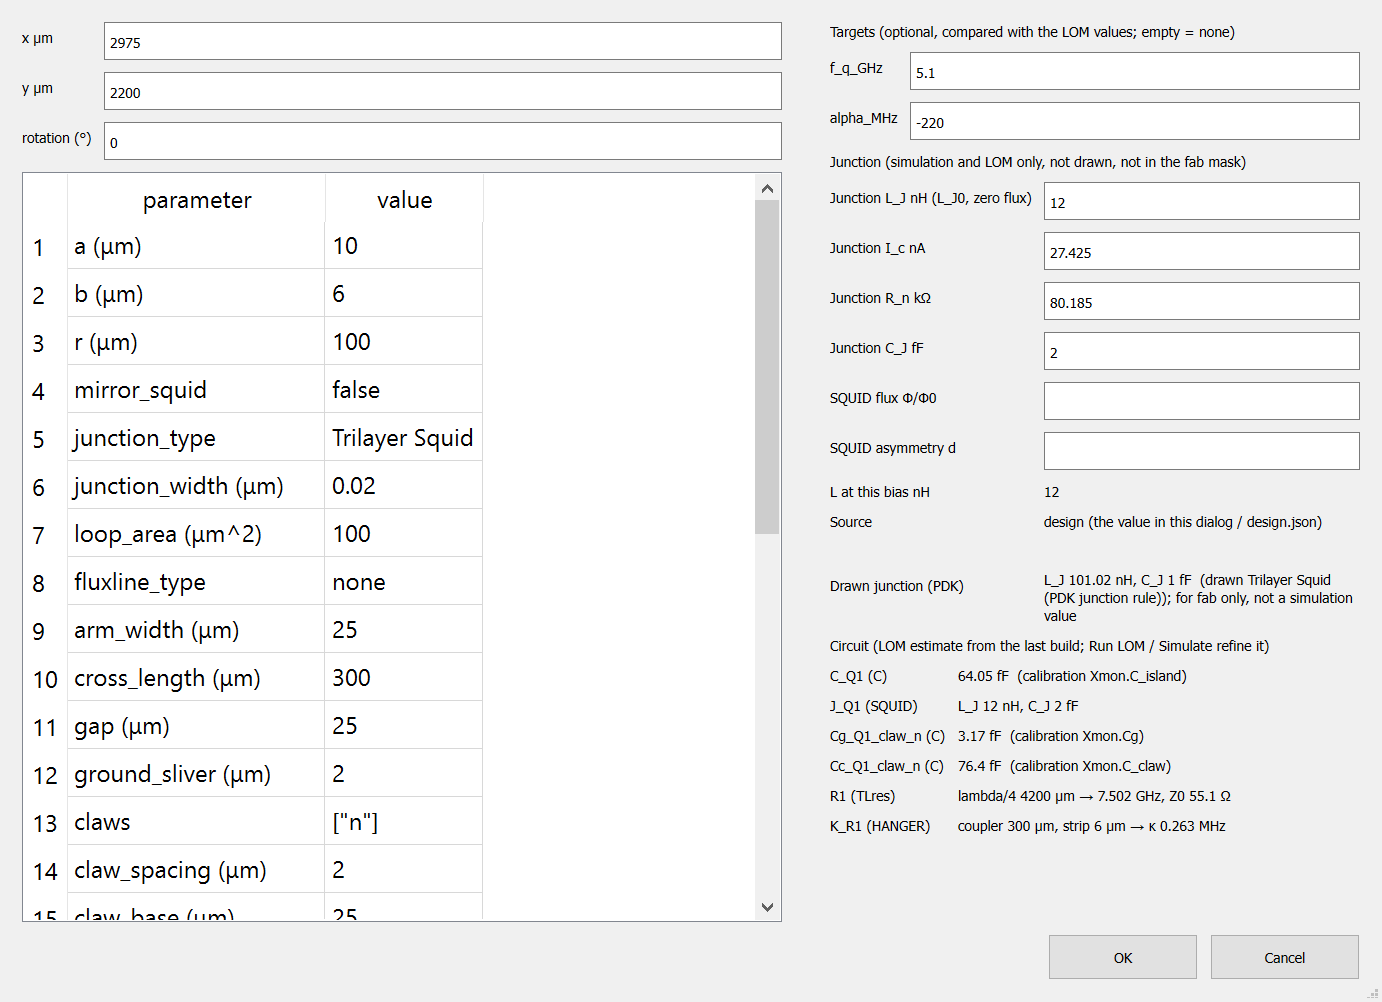
Edit selected component (Ctrl+Shift+Q) for the Xmon: position and rotation, the cell parameters, targets (f_q, alpha), the junction section (L_J, I_c, R_n, C_J, SQUID flux) and the LOM estimates of the component’s branches.
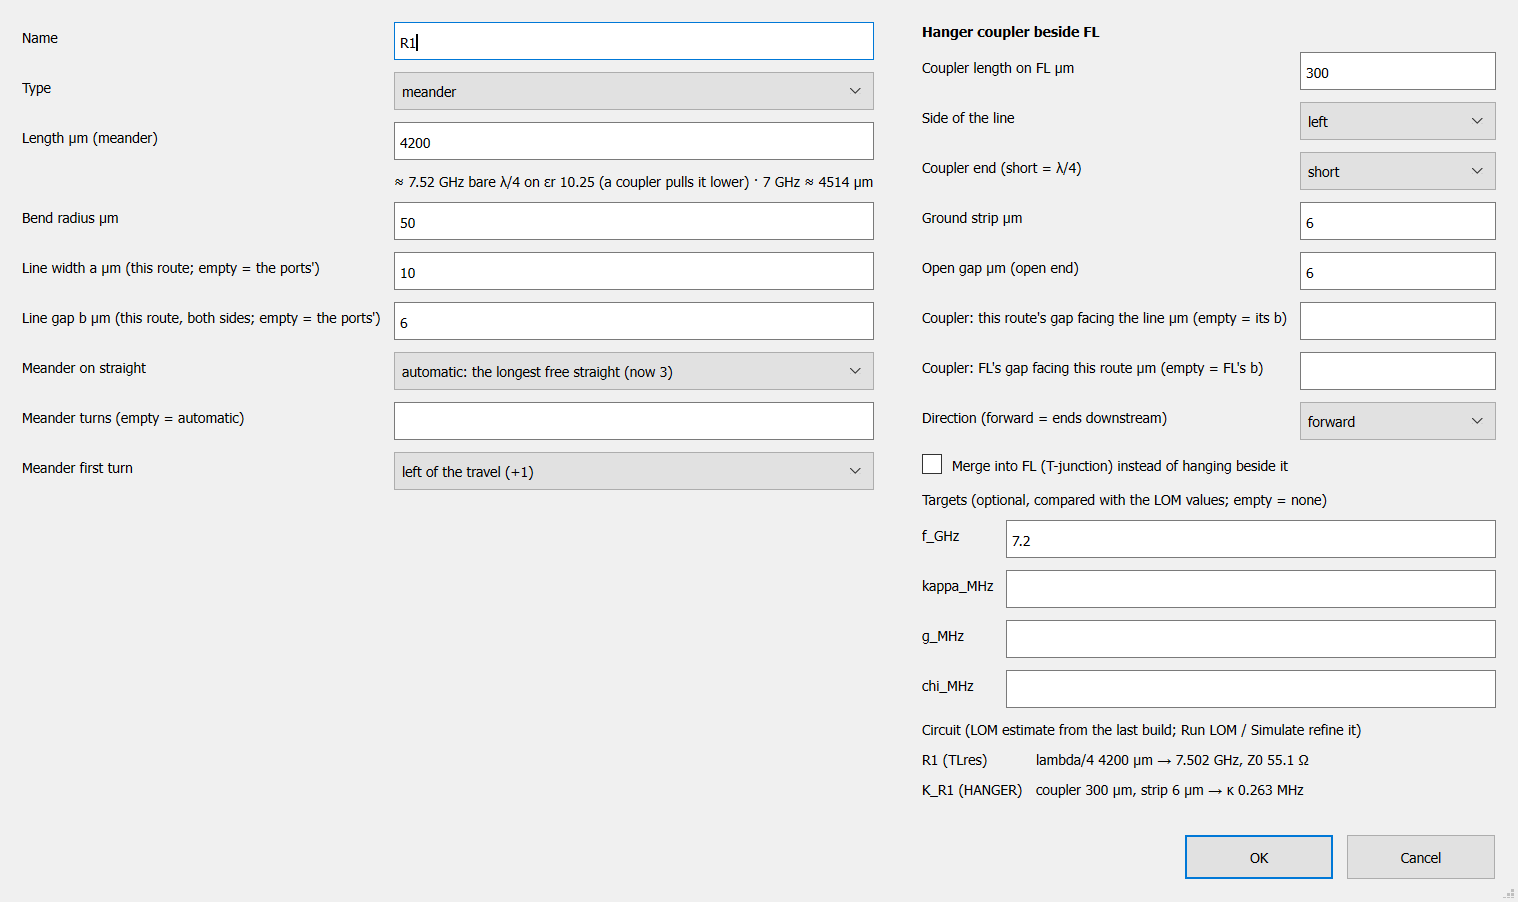
The route dialog of R1: meander length (with the bare lambda/4 estimate), bend radius, line width and gap,
the hanger coupler beside FL (length, side, end), targets, and the LOM rows of the route (lambda/4 line, hanger kappa).
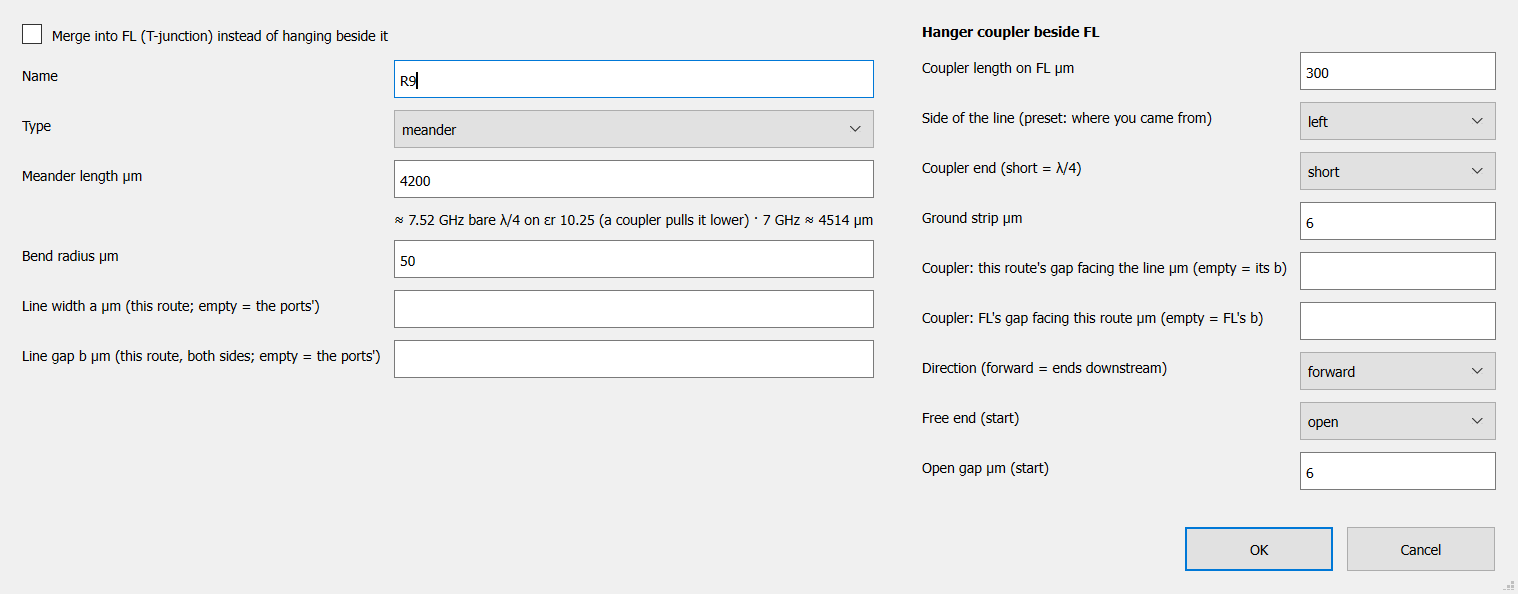
The hanger dialog.
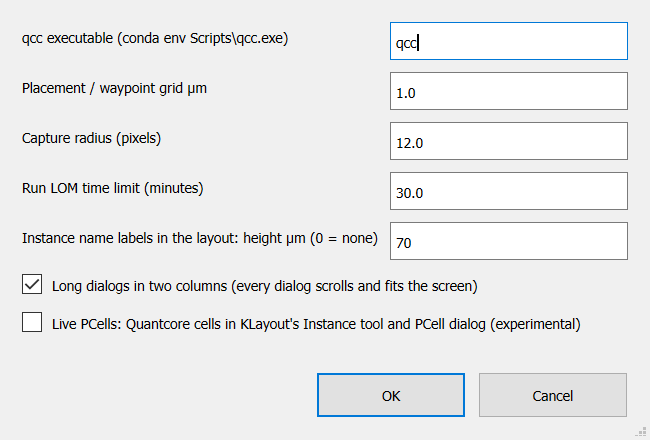
Settings: the qcc path, grid, capture radius, Run LOM time limit, instance label height, two-column dialogs and Live PCells.
Flow: LOM, Simulate, Results, Propose, Fab
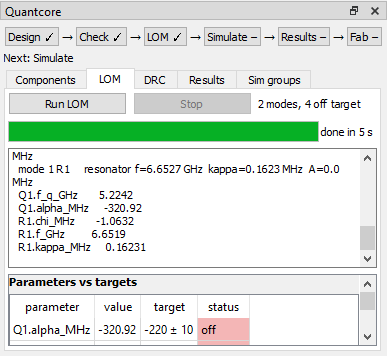
The LOM tab after Run LOM: modes, parameters against targets, progress. Run LOM always solves the whole chip.
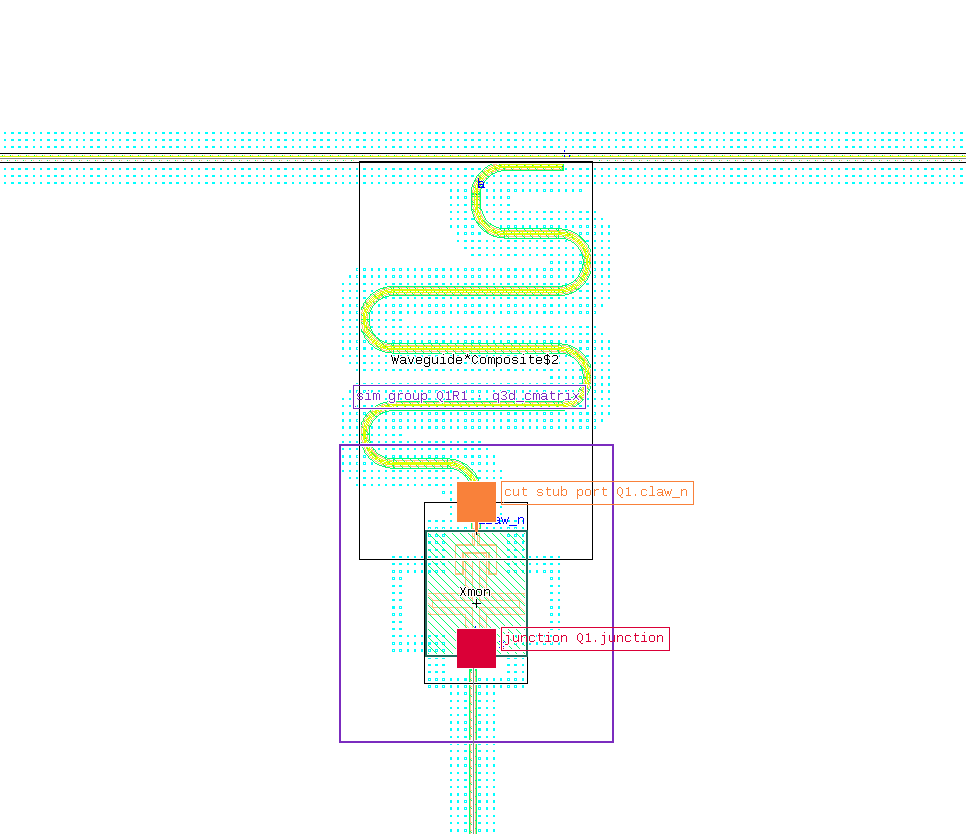
The Sim groups tab draws a saved group’s box, its components and ports on the layout. Groups are made by Simulate and are not part of the chip or any export.
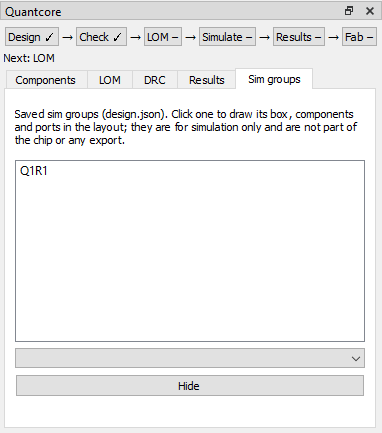
The Sim groups tab: pick a saved group to draw it.
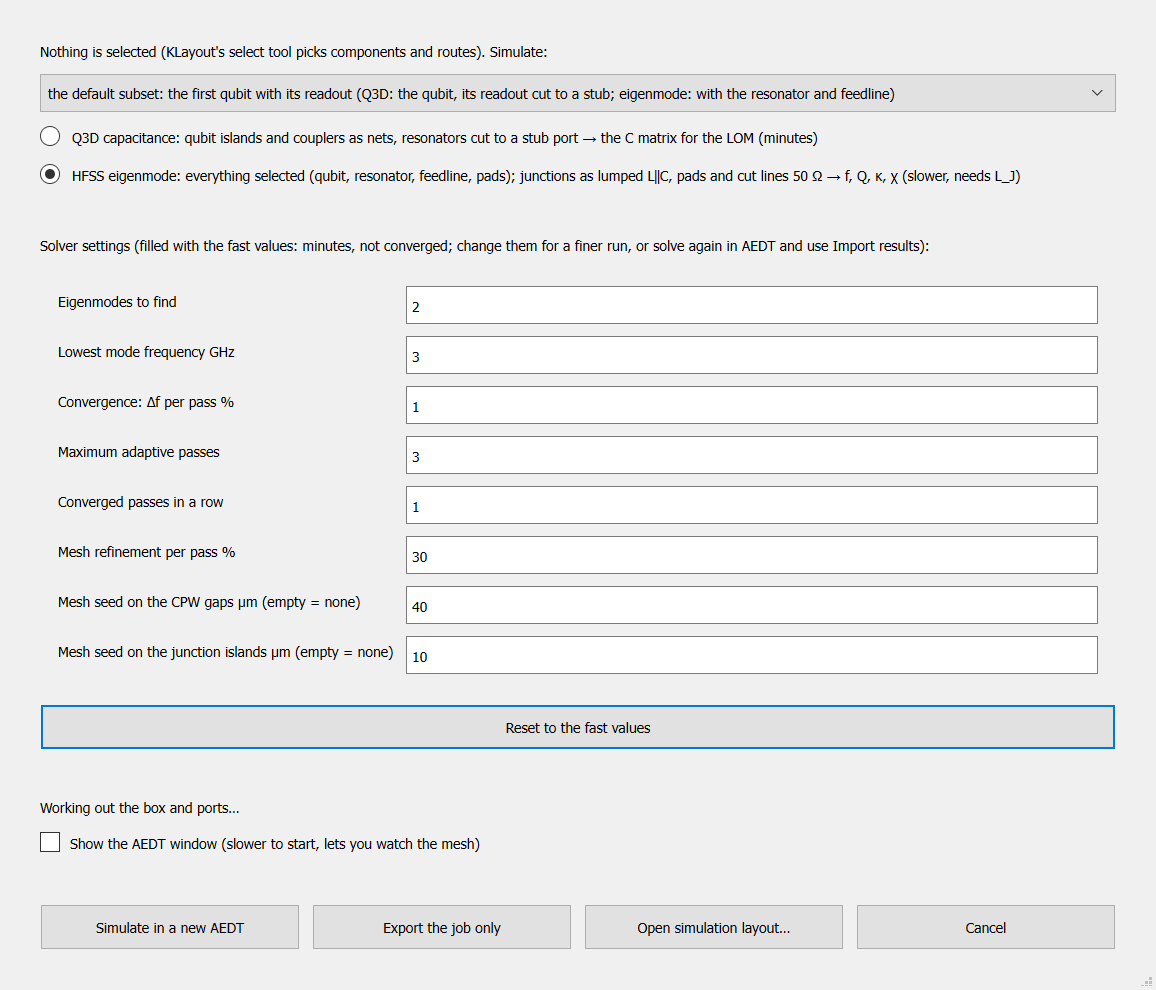
Simulate dialog: which components, which analysis (here Q3D capacitance or HFSS eigenmode), the fast solver settings, and the buttons Simulate in a new AEDT, Export the job only and Open simulation layout.
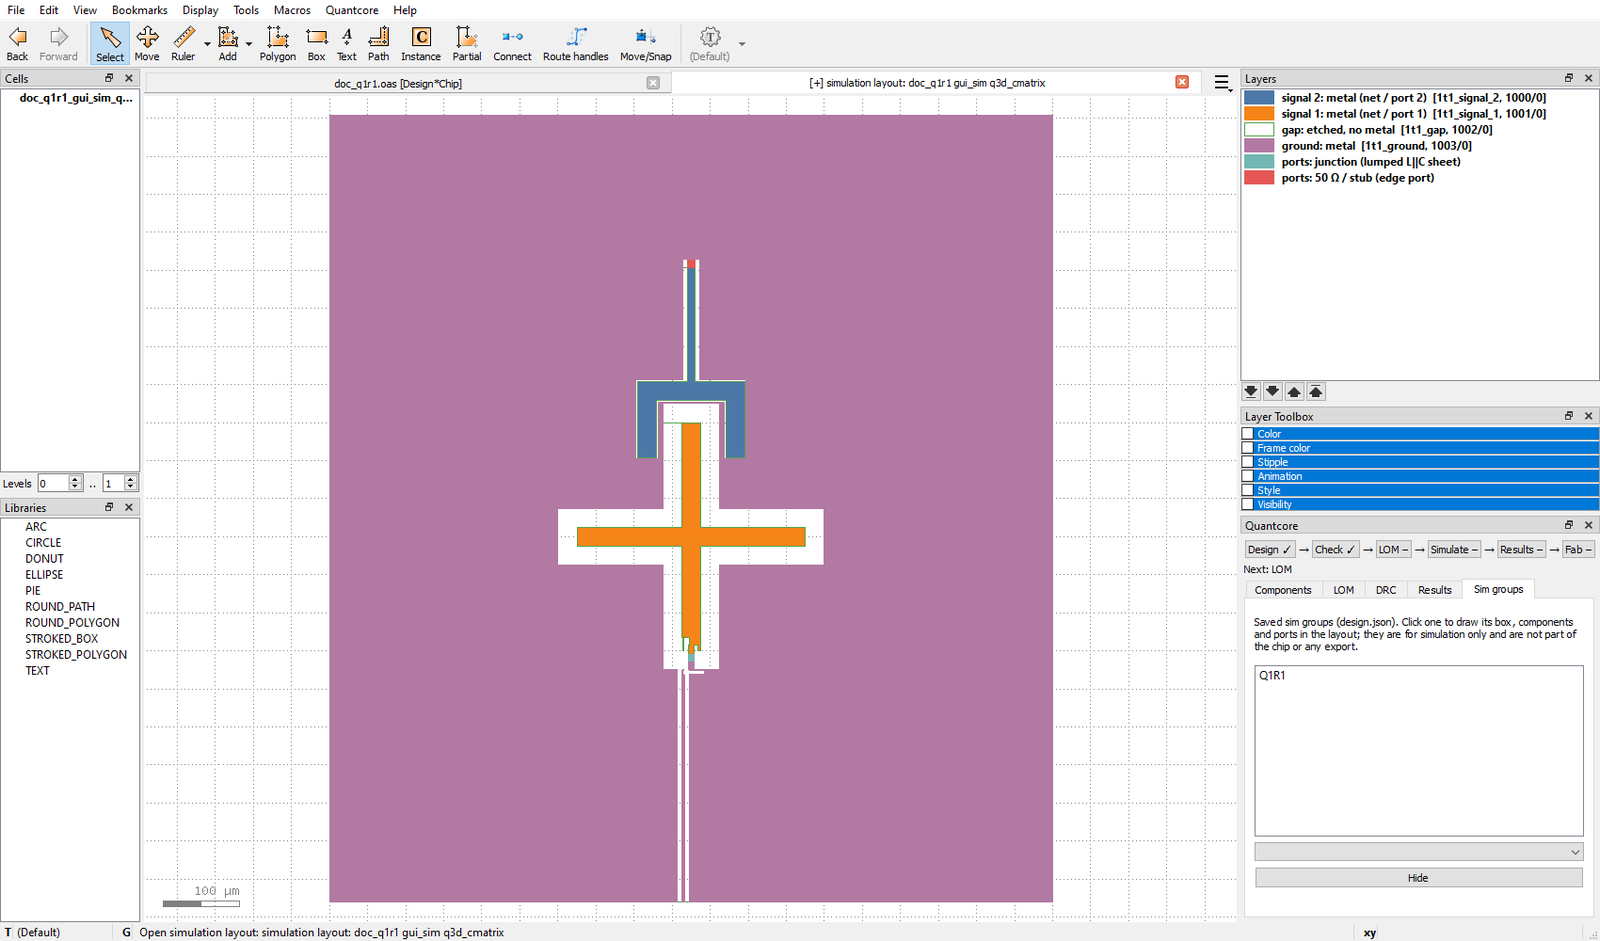
Simulate > Open simulation layout: the geometry AEDT would import, in a new tab, with readable layers (signal 1 and 2, gap, ground) and the port polygons (junction, 50 ohm edge port). No AEDT is started; the design is untouched.
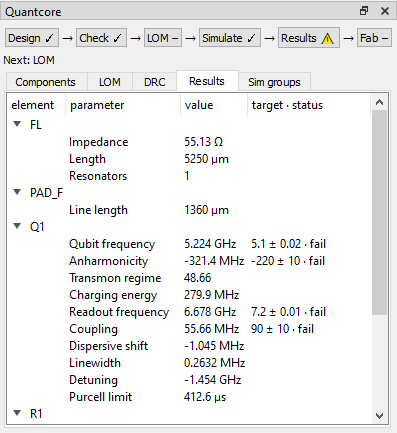
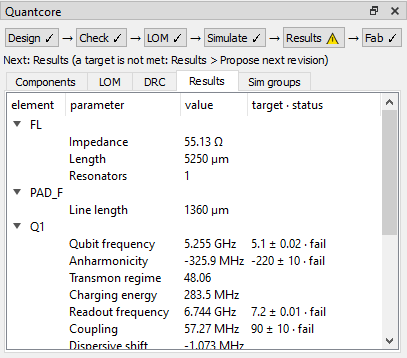
The Results tab after Import results: each value with its target and pass / fail status. This result file is a test fixture for a different design, so the numbers show how the tab works, not a real simulation of this chip.
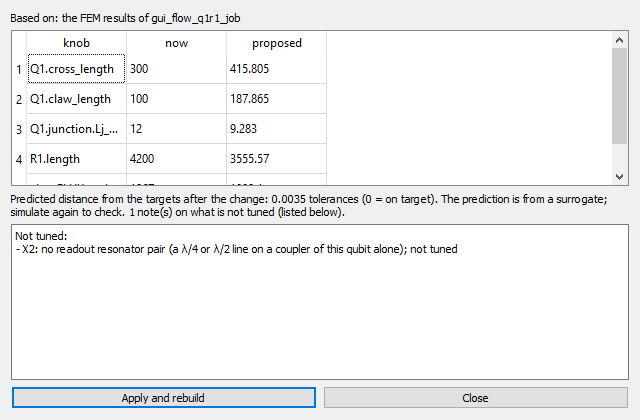
Results > Propose next revision: knobs now and proposed. Apply writes them to design.json as one undo step and
rebuilds. Qubits without a readout pair are listed as “not tuned”.
After Fab > Export for fab: the panel at the end of the flow. The bundle holds <name>_fab.oas, circuit.json,
design.py and a PNG.
Known gaps
What has not been tested, and what is not built:
Eigenmode from the Simulate dialog,
--aedt guifrom the plugin and a whole-chip simulation from the GUI have not been tested. The smoke test ran Q3D of one qubit in a new non-graphical AEDT.Whole-chip Run LOM of the 12-qubit and 5-qubit tutorial chips takes more than 600 s; the 21-qubit chip needs a bigger machine.
Freeform shape to component capture, per-instance values on hover, and snapping a component to a line are not built.
The full list is in status and in the plugin README, “Not done yet”.